Figures & data
Fig. 10 Comparison of k L against U ∞ between laboratory and field measurements. Symbols and lines as in Fig. 8. A solid line shows the correct correlation curve of eq. (11) normalized to Sc=660 for the present laboratory measurements.
![Fig. 10 Comparison of k L against U ∞ between laboratory and field measurements. Symbols and lines as in Fig. 8. A solid line shows the correct correlation curve of eq. (11) normalized to Sc=660 for the present laboratory measurements.](/cms/asset/d8cd4dc5-d20e-4258-839d-074a6c83d331/zelb_a_11817294_f0001_ob.jpg)
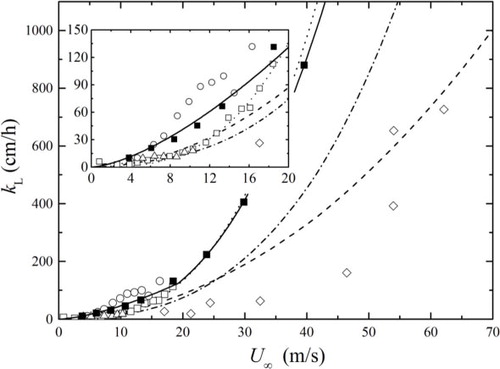
Table 1. Mass transfer velocity and correct velocities