Figures & data
Table 1. Acronyms used in the texts
Fig. 1 Research domain setting and geographical locations of the sites selected for model evaluation as well as five defined sub-regions of China (green box for West China, yellow box for South China, red box for Middle China, blue box for North China and orange box for Northeast China).
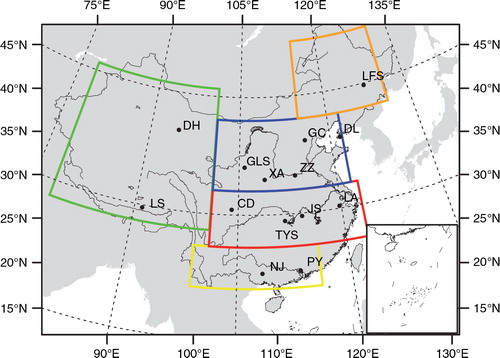
Table 2. The refractive indices of α-pinene SOA under different wavelengths in literature
Table 3. The toluene refractive indices under different wavelengths in literature
Table 4. Experiment settings including size distribution parameters, optical properties (at 550 nm) and category of SOA
Fig. 2 (a) NCEP Reanalysis 840 mb wind (m s−1) and TRMM precipitation (mm hr−1) field averaged over July 2006. (b) RegCM 840 mb wind field (m s−1) and precipitation (mm hr−1) averaged over July 2006.
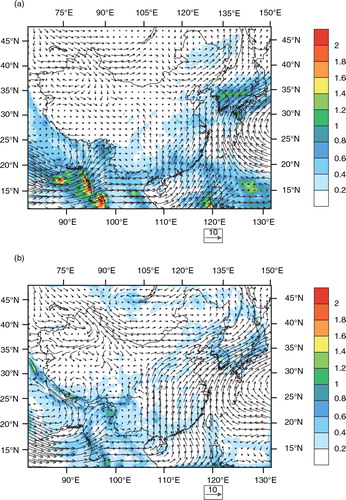
Fig. 3 (a) Isoprene, (b) α-pinene, and (c) limonene emission (mg m−2 day−1) averaged over July 2006.
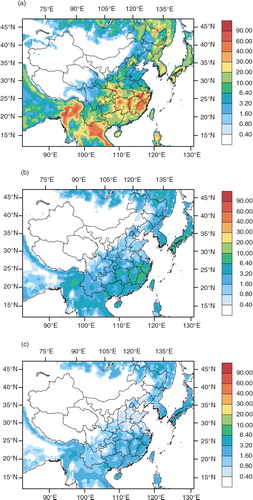
Fig. 4 (a) OC and (b) xylene emission (mg m−2 day−1) averaged over July 2006.
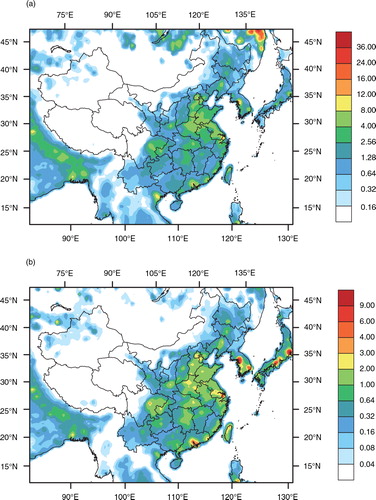
Table 5. Precursors’ simulated emission statistics over Chinaa
Fig. 5 (a) ASOA, (b) BSOA, and (c) ISOA concentration (µg m−3) at model surface averaged over July 2006.
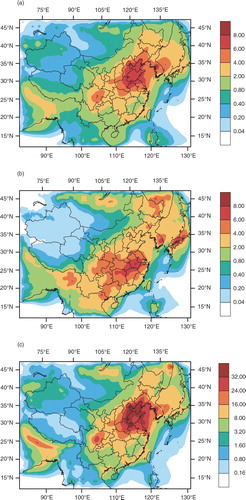
Fig. 6 Vertical distribution (µg m−3) of ASOA with effective saturation concentrations of (a) 1, (b) 10, (c) 100, (d) 1000 µg m−3 at 300 K and BSOA with effective saturation concentrations of (e) 1, (f) 10, (g) 100, (h) 1000 µg m−3 at 300 K averaged along longitude over July 2006.
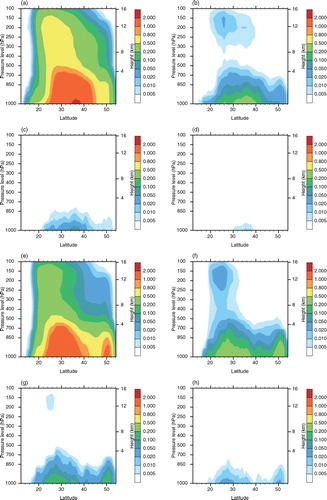
Table 6. Tendencies for tracer transport and chemistry at model surfacea
Fig. 7 (a) ASOA, (b) BSOA, and (c) ISOA column burden (mg m−2) averaged over July 2006.
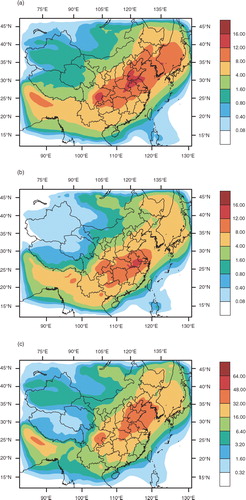
Fig. 8 (a) Observed OM and simulated OC concentration (µg m−3) averaged over July 2006 for 14 sites. (b) AOD averaged over July 2006 for 14 sites. The bars are simulated ASOA and BSOA AOD, and the dots are monthly-averaged MODIS AOD.
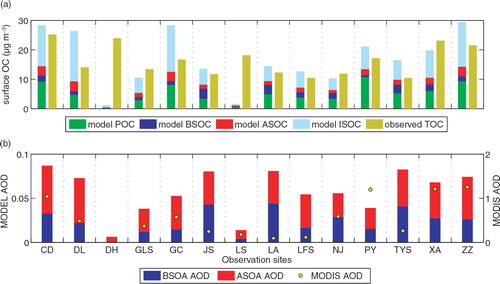
Fig. 9 Aerosol optical depth of ASOA and BSOA averaged over July 2006 for experiment (a) ABP, (b) AUL, (c) BBP, and (d) BUL.
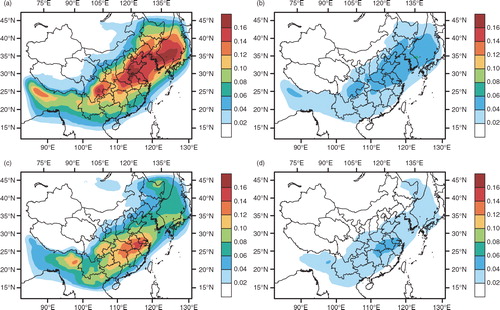
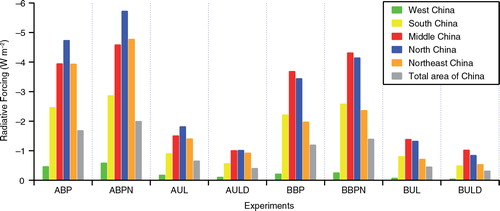
Fig. 10 TOA RF (W m−2) averaged over six regions (West China, South China, Middle China, North China, Northeast China and the total area of China) in China over July 2006 for eight experiments (ABP, ABPN, AUL, AULD, BBP, BBPN, BUL and BULD).