Figures & data
Fig. 1 IASI–SOFRID O3UT (190–290 hPa) for 3 months average (October–December 2008). 200–300 hPa horizontal wind from ECMWF reanalysis are represented as black arrows. The dashed white line represents the ±1.5 PV units surface from ECMWF reanalysis at 200 hPa for the same period.
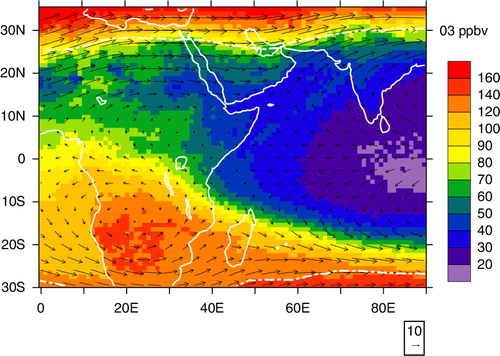
Fig. 2 IASI–SOFRID UT O3 (190–290 hPa average), in ppbv, for (a) 26–28 November, (b) 29 November–1 December, (c) 2–4 December 2008, (d) 5–7 December 2008. 200–300 hPa averaged horizontal wind from ECMWF reanalysis are represented as black arrows. The blue line represents the ±1.5 PV units surface from ECMWF reanalysis at 200 hPa. Black hatched contours indicate OLR below 220 W/m2. The black and grey lines in (a) and (c) indicate the flight track for MOZAIC observations, Hy–Fr and Fr–Hy respectively. The coloured boxes in (b) over Arabian Sea shows the starting boxes of particulate emissions for FLEXPART simulations.
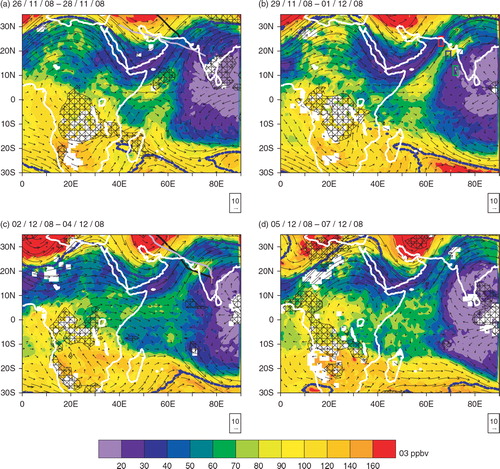
Fig. 3 Longitude–pressure cross-sections of IASI O3 volume mixing ratios vertical profiles along four MOZAIC flight tracks for (a, b) 27 November, (c, d) 3 December 2008. The IASI data are averaged over (a, b) 26–28 November (c, d) 2–4 December 2008. The coincident ozone MOZAIC observed volume mixing ratios are displayed with the colour-coded circles. The black solid line is the tropopause derived from NCEP data.
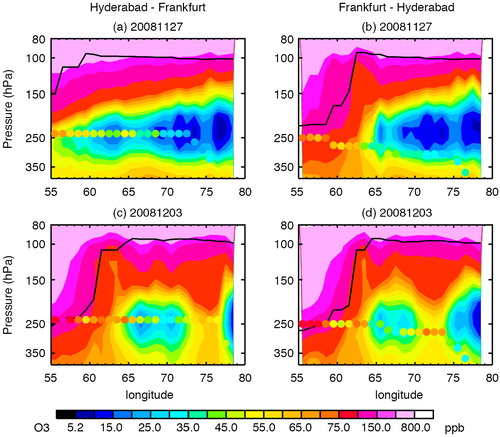
Fig. 4 (a) Longitudinal profiles of MOZAIC O3 (black line) and CO (violet line) mixing ratios along a Hyderabad Frankfurt flight on 3 December 2008 with the altitude of the aircraft (dashed black line). (b) Meso-NH passive tracers normalised concentrations along the MOZAIC flight at 258 hPa. Concentrations have been normalised relative to their respective maxima over the whole simulation domain. The red curve corresponds to BBTR, the green to LITR and the blue to ANTR. (c) Meso-NH and ECMWF relative humidity along the MOZAIC flight.
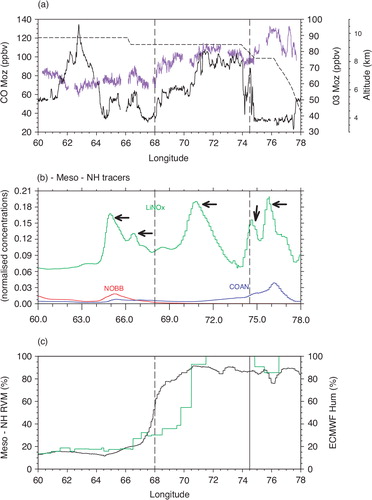
Fig. 5 The colour coded solid contours represent the area encompassing 70% of the FLEXPART total retroplume residence times for particles released between 29 November 12 UT and 2 December 12 UT from the corresponding colour coded boxes (the blue rectangle is within the O3R) (a) residence times within the BL (0–3 km) with monthly GFED3 fire data and monthly MACCity anthropogenic emissions (fluxes are normalised to their respective maxima) and (b) residence times within the UT (9–15 km) with LIS/OTD HRMC flash rates (values given in fl/km2/yr are normalised to their maximum) for November 2008.
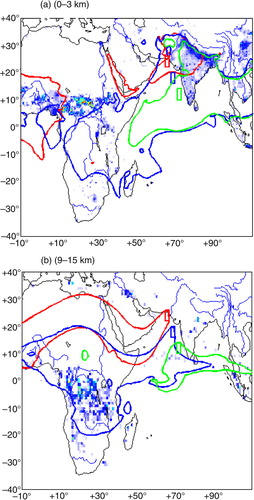
Fig. 6 Meso-NH passive tracers distributions at 210 hPa from 26 November to 4 December 2008 averaged over 3 days. (a) 26–28 November 2008, (b) 29 November to 1 December 2008, (c) 2–4 December 2008. Concentrations were normalised relative to the maxima values over all vertical levels. The red plume corresponds to BBTR, the green one to LITR and the blue one to ANTR. And the blue isocontour corresponds to 60 ppbv O3 from IASI and delimits the position of the O3R.
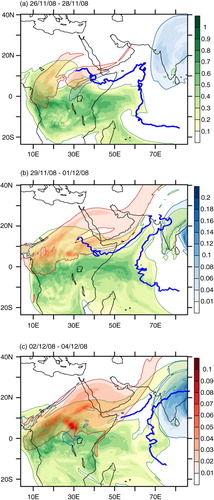
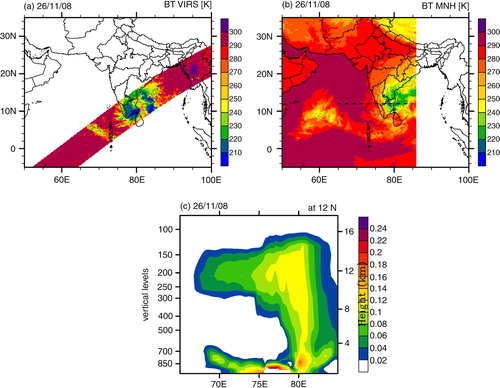
Fig. 7 26 November 2008 10.8 µm BT (°K) (a) measured by TRMM/VIRS and (b) simulated by Meso-NH. (c) Cross-section of Meso-NH simulated anthropogenic tracer ANTR at 12°N with concentrations normalised by their maximum value at this latitude. The corresponding section is represented by a black line on the plot (b).