
Figures & data
Fig. 1 A close assessment of the scattering distributions: observed versus computed by the Mie Theory. The computations are based on the (Da<1 µm) particle size distributions measured by a SMPS particle spectrometer: (a.1) at 450 nm, (a.2) at 550 nm and (a.3) at 700 nm and the (1 µm<Da<10 µm) particle size distributions measured by an APS particle spectrometer: (c.1) at 450 nm, (c.2) at 550 nm and (c.3) at 700 nm. A close assessment of the backscattering distributions is also shown in b and d. The 1:1 line is the dashed line. On each panel, the nephelometer wavelength, the refractive index, the slope±SE of the fit (blue line) and the R correlation coefficient are shown.
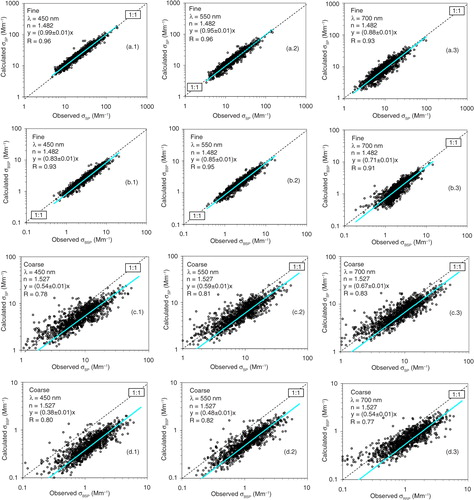
Table 1. Statistics for the main microphysical and optical aerosol parameters (for dry conditions) from 1 May to 30 September 2009, at El Arenosillo Station
Fig. 2 Mean hourly sub-micron scattering ratio (RSP) versus Ångström exponent (å) and RSP ratio and fraction of backscattered light (b) versus sub-micron volume ratio (RV) during the analysed period. The mean values (black lines) were calculated over 0.1 Mm−1 σSP and 0.1 RV bins.
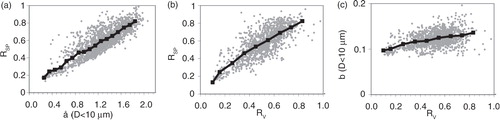
Fig. 3 Desert dust episode at El Arenosillo Station observed during 25–26 July 2009. (a) Sub-micron volume concentration (V1), super-micron volume concentration (V10–1) and total volume concentration (V10) measured by the SMPS-APS system. (b) Daily plots of the dust surface concentration (in µg m−3), provided by the BSC/DREAM model over the Iberian Peninsula from 25 to 27 July. The hours elapsed since the forecasts are indicated between brackets (www.bsc.es/projects/earthscience/DREAM). El Arenosillo Station is identified as a blue dot in the first (b).
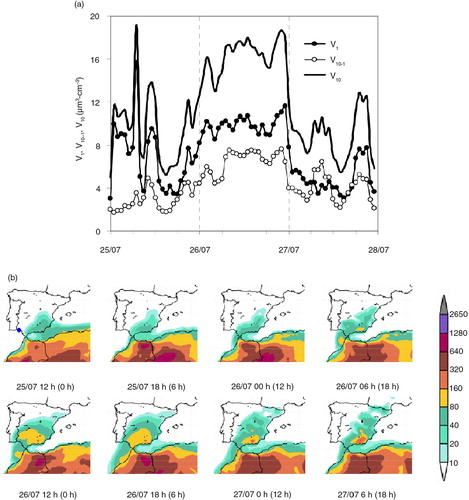
Fig. 4 The back-trajectory frequency evaluated by the HYSPLIT Model at three altitudes, calculated every hour during the desert dust (DD) events. The air flows during the DD-MF days at (a) 500 m, (b) 1500 m and (c) 3000 m and during the DD-MAF days at (d) 500 m, (e) 1500 m and (f) 3000 m. El Arenosillo Station is identified as a red star and the source area of DD as a red line in (a). The colours indicate the frequency (in %) of a backward trajectory crossing over a geographical point (green: >0.1%, dark blue: >1% and yellow: >10%).
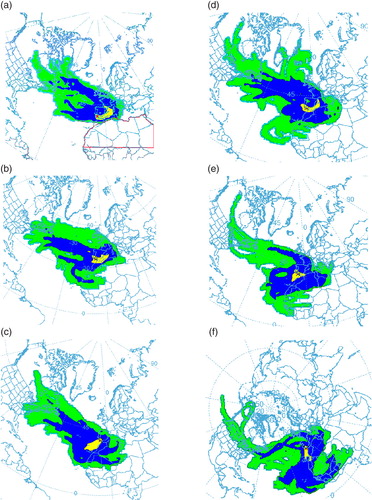
Table 2. Mean hourly values of the primary microphysical and optical aerosol parameters (for dry conditions) during the N-DD, DD-MF and DD-MAF days from 1 May to 30 September 2009
Table 3. Statistics (absolute and relative differences) of microphysical and optical properties (for dry conditions) between desert dust and non-desert dust days (N-DD & DD-MF and N-DD & DD-MAF)
Fig. 5 Mean size distribution of V and σsp and the fitting size distributions of the two log-normal modes and their sum for each type of day (N-DD, DD-MF and DD-MAF). (a, b and c): dV/d log D and (d, e and f): dσsp/d log D. The modal parameters (geometric mean diameter, Dg, the geometric SDs, σg, and the total mode concentration), V and σsp are also shown.
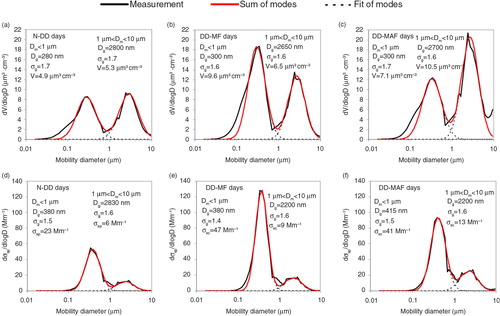
Table 4. Pearson's correlation coefficients (R) obtained by linear regression of AOD (500 nm) versus V within several particle size ranges, as well as, between RSP and RV with FMF
Table 5. The coefficients a and b of the linear regression V=a·AOD+b, for R>0.7, as shown in Table 4.