Figures & data
Fig. 1 Map showing the spatial coverage of 38494 MOZAIC flights between 1994 and 2014. Airline names are shown on the top right corner, and the MOZAIC system and Inlet are seen on the bottom left corner.
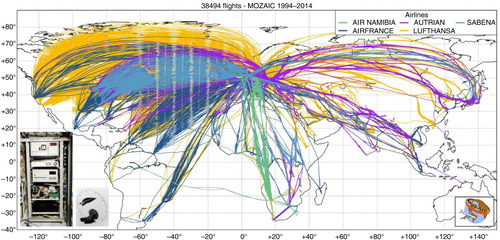
Table 1. Parameters provided by the A340/A330 aircraft system
Fig. 2 Scheme of the IAGOS system mounted on an Airbus aircraft (Package1+Optional Package2).
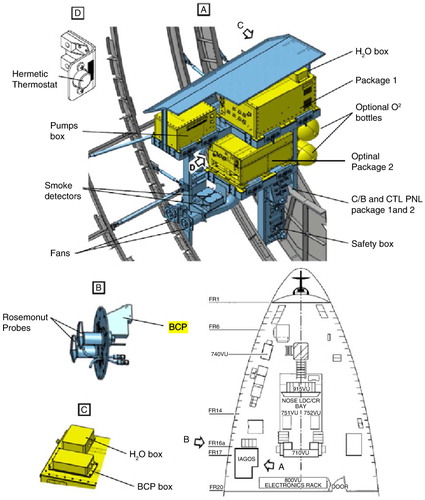
Fig. 3 Scheme of the IAGOS inlet plate fixed to aircraft fuselage.
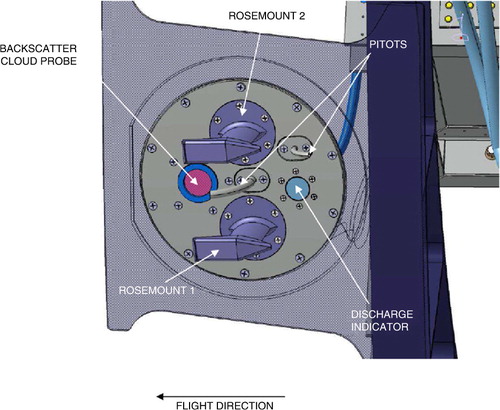
Table 2. Aircraft currently equipped with the IAGOS instruments
Fig. 4 Package1 picture and schemes. Without H2O and BCP boxes, Package1 weighs 35 kg and the dimensions are 630×450×314 mm. The main elements are listed and described in . (a) Photo of Package1. BCP box and H2O box are fixed on top. The GSM antenna for data transmissions is seen on the connectors face bottom left side. (b) Scheme of Package1 inside. (c) Scheme of the upper shelf viewed from the top. (d) Scheme of the lower shelf viewed from the top.
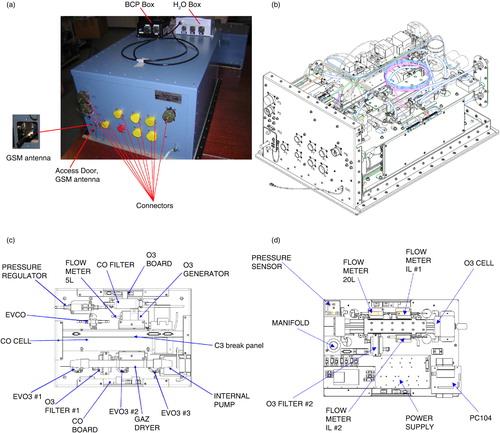
Table 3. List and description of Package1 subassemblies
Fig. 5 Package1 air flow diagram within the upper and lower plates.
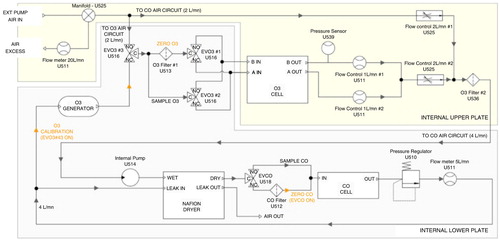
Fig. 6 IAGOS pump box – the box contains two pumps in parallel (see text), the electronic control cards and a Teflon solenoid valve. All tubing are Teflon-coated with a 1/4 inch diameter.
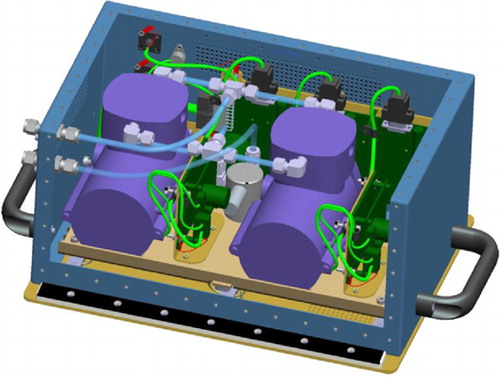
Table 4. Measured parameters stored during flights by the Package1
Table 5. Summary of the IAGOS O3 and CO instrument characteristics
Fig. 7 Quick-look example. On top, flight information and external pump flow check (here displayed in Volts). Graphs of the flight route, flight altitudes, O3 and CO vertical profiles and time series with clouds detected by the BCP shaded in grey. On the profiles, the thin dash lines represent the profile of the previous flight. On bottom, time series of H2O sensor voltage, and the total and static temperatures measured by the aircraft and by H2O sensor in its Rosemount housing (raw data not calibrated).
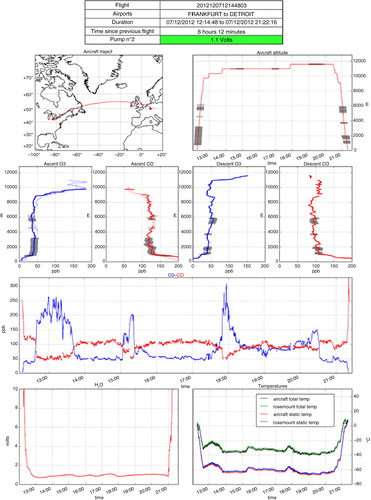
Fig. 8 The combined MOZAIC and IAGOS fleet have landed in more than 147 different airports around the world since July 2011. Symbol sizes are proportional to the total number of landings and takeoffs for a location. Monthly map of flights are available on the IAGOS website (www.iagos.fr/web).
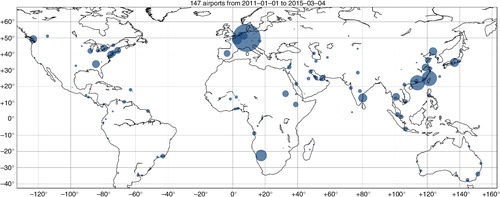
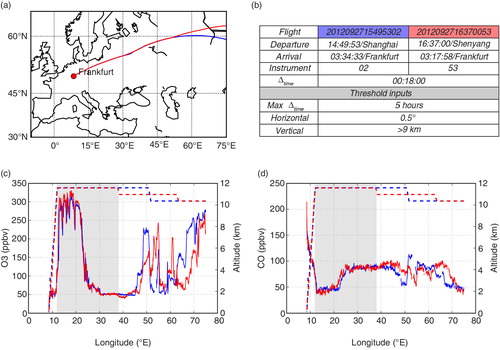
Fig. 9 Examples of flight profile intercomparison automatically made available within the IAGOS database as soon as at least two flights land or take-off within a 3-h time window at the same airport. 53, 35 and 51 are the MOZAIC instruments, and 03 and 04 are the IAGOS instruments. Colours found in the profile plots correspond to the flight in the table on top. (a) Flight landing times at Frankfurt, (b) quick information, (c) routes around Frankfurt, (d) O3 profile and (e) CO profile.
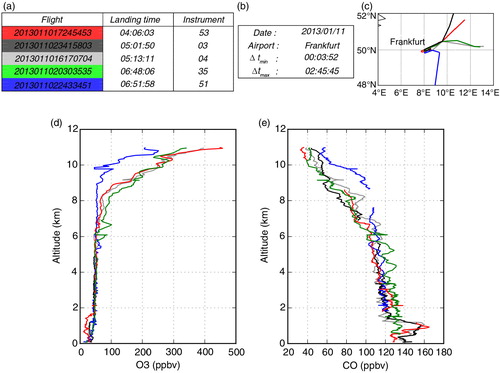
Fig. 10 Flight intercomparison scatterplots between the MOZAIC and the IAGOS instruments for O3 and CO concentrations measured during ascent and descent profiles. Scatterplots compile 32 and 55 validated (L1) intercomparison profiles, respectively, for (a) O3 and (b) CO recorded between July 2011 and December 2012. Dashed line is the 1:1 line and the grey shading represents the total instrument uncertainties. Red crosses and blue dots are the data measured below and above 1000 m, respectively.
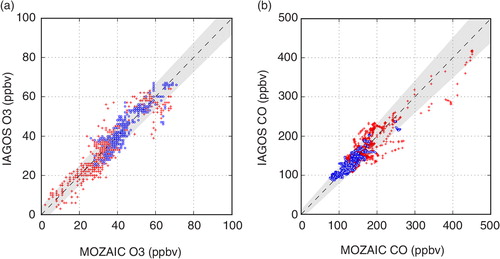
Fig. 11 Example of flight intercomparison at cruising altitudes (>9 km). Plots are automatically made available within the IAGOS database as soon as at least two flights shared the same route distant by <0.5° of latitude/longitude and within in a 5-h time window. (a) Flight routes, (b) flight intercomparison summary table, (c) O3 and cruising altitude and (d) CO and cruising altitude.