Figures & data
Fig. 1 The advanced IAGOS Capacitive Hygrometer bases on a compact capacitive sensor measures relative humidity and differs from the MOZAIC Capacitive Hygrometer by the thin-film polymer composition. The improved hydroactive polymer composition of Vaisala HUMICAP® type H has a larger capacitance to increase the sensitivity. For signal processing, the Vaisala HMT333 transmitter unit is used. Courtesy of Vaisala Oyj, 2015.
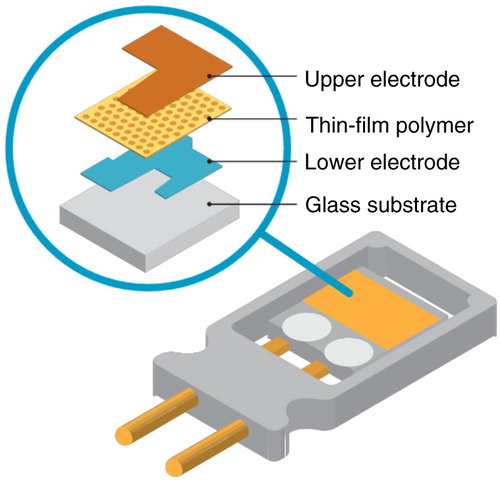
Table 1. Field study data overview for cruise altitude
Table 2. Participating hygrometers during CIRRUS-IIIa and AIRTOSS-ICEb
Fig. 2 Probability distribution functions (PDF) show the distributions of the measured sensor temperatures during a) 15 yr of MOZAIC measurements, b) CIRRUS-III and c) AIRTOSS-ICE. The red line indicates the lower limit of the sensor calibration. The grey line illustrates the most probable value of MOZAIC distribution.
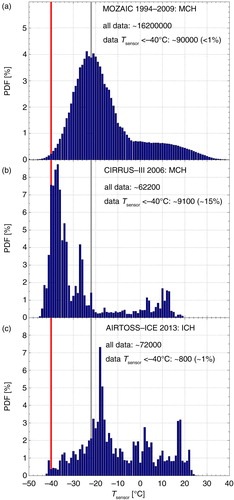
Fig. 3 RHliquid and T sensor (blue dotted line) sequence of an AIRTOSS-ICE flight. Small-scale fluctuations of the measured reference RHliquid (black line) can be resolved by the ICH (red line) in warmer air masses (white background). In colder air masses with T sensor<−20°C, the ICH seems to measure the smoothed background.
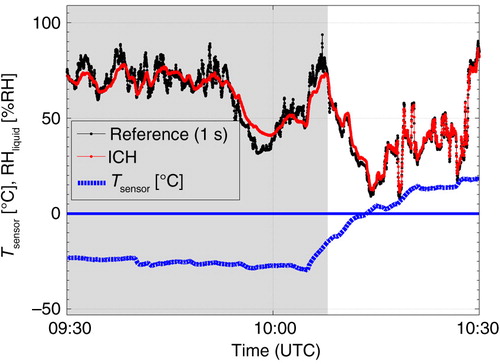
Fig. 4 Example to demonstrate the way to determine the most probable response time in the temperature bin T=243 K for AIRTOSS-ICE flight 3.
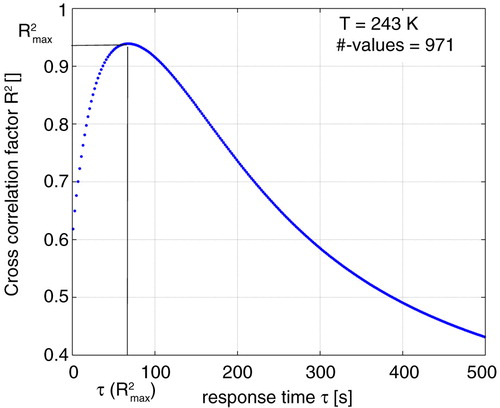
Fig. 5 Determined response times per temperature bin and flight for the CIRRUS-III (blue squares) and AIRTOSS-ICE (red stars) flights. The robust exponential fit (black line) through the data leads to the MCH and ICH characteristic temperature-dependent response time τ [see eq. (2)].
![Fig. 5 Determined response times per temperature bin and flight for the CIRRUS-III (blue squares) and AIRTOSS-ICE (red stars) flights. The robust exponential fit (black line) through the data leads to the MCH and ICH characteristic temperature-dependent response time τ [see eq. (2)].](/cms/asset/1fd8ea1b-a3c6-49c5-a7e0-70017317f388/zelb_a_11817329_f0005_ob.jpg)
Fig. 6 From top to bottom: RHliquid measured by the ICH (red) and the measured reference (black), that is, FISH (clear sky) and SEALDH-II [in-cirrus (blue dots) and above 1000 ppmv]; RHliquid measured by the ICH (red) and the smoothed reference (EMA including the temperature-dependent response time, black); Δ RHliquid (ICH and reference) as envelope for the measured reference and as green line for the smoothed reference, as a function of flight time during the AIRTOSS-ICE flight on 3 September 2013; and sensor temperature T sensor (black) as well as the lower temperature limit of the calibration (red).
![Fig. 6 From top to bottom: RHliquid measured by the ICH (red) and the measured reference (black), that is, FISH (clear sky) and SEALDH-II [in-cirrus (blue dots) and above 1000 ppmv]; RHliquid measured by the ICH (red) and the smoothed reference (EMA including the temperature-dependent response time, black); Δ RHliquid (ICH and reference) as envelope for the measured reference and as green line for the smoothed reference, as a function of flight time during the AIRTOSS-ICE flight on 3 September 2013; and sensor temperature T sensor (black) as well as the lower temperature limit of the calibration (red).](/cms/asset/5abee017-e5b1-4aee-a3a9-8139d90565db/zelb_a_11817329_f0006_ob.jpg)
Fig. 7 (a) presents comparisons between the RHliquid data from MCH and the measured reference, that is, FISH (clear sky) and OJSTER (in-cirrus), during CIRRUS-III. (b) shows results of comparisons between ICH and the measured reference, that is, FISH (clear sky) and SEALDH-II (in-cirrus and above 1000 ppmv), during AIRTOSS-ICE campaign; the straight line indicates the linear regression line, while the dashed lines illustrate the sensor uncertainty range ±5% RHliquid. In the transition area measurements of both reference instruments can occur.
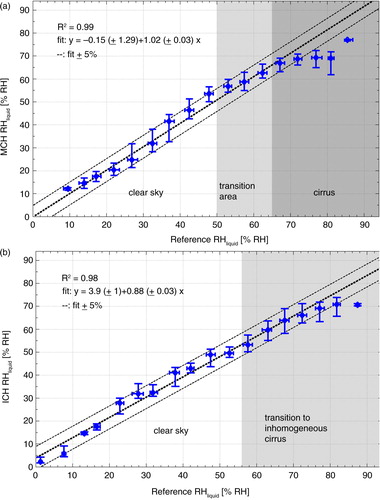
Fig. 8 Similar to Fig. 7, but the reference RHliquid data are smoothed prior to the comparisons of (a) CIRRUS-III and (b) AIRTOSS-ICE.
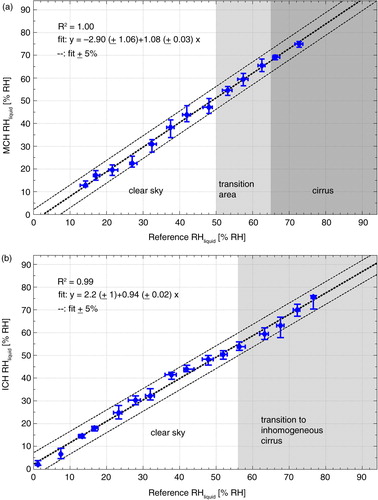
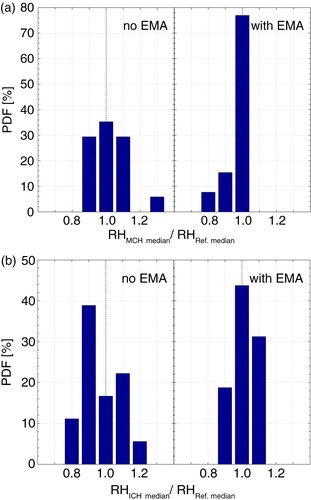
Fig. 9 Frequency of occurrence of the ratios of MCH to reference RHliquid (a) and of ICH to reference RHliquid (b), respectively. Both figures are divided into the PDF of original (left panel) and smoothed (right panel) reference data.