Figures & data
Fig. 1 Map of reported sites in this study. (a) Distribution of stations in the atmospheric circulation map over East Asia by Araguas-Araguas et al. (Citation1998). (b) Seasonal precipitation difference (JJA-DJF) and 850-hPa wind streams during July–September. Black dots in both panels refer to our sampling sites, and numbers refer to other stations subjected to lagged correlation analysis in this study: (1) Delingha (37°22′N, 97°22′E), (2) Lhasa (29°40′N, 91°7.8′E), (3) Lulang (29°46′N, 94°43′E), (4) Changsha (28°13′N, 112°55′E), and (5) Guangzhou (23°10′N, 113°19′E). Wind data are derived from monthly long-term averages during 1981–2010 in the NCEP/NCAR reanalysis data (Kalnay et al., Citation1996), and precipitation data derived from those in the GPCP version 2.2 data set.
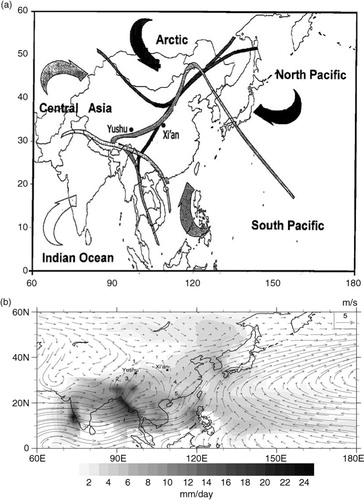
Fig. 2 Stable oxygen isotope in daily precipitation and corresponding meteorological parameters at Yushu and Xi'an. (a) Daily δ18O variations (black dotted curve) with corresponding temperature (grey curve with open dots) and precipitation amount (grey columns) during observation period of 4 yr at Xi'an. (b) Same as (a), but for Yushu. (c) Four-year monthly δ18O and major meteorological parameters with error bars at Xi'an. (d) Same as (c), but for Yushu. Semi-transparent grey bars in (a) highlight the coincidence of dramatic isotopic depletion with the temperature drop, while black boxes mark the coincidence with frequent precipitation. Grey triangles in (b) indicate long-term monthly averages of GNIP data at Xi'an.
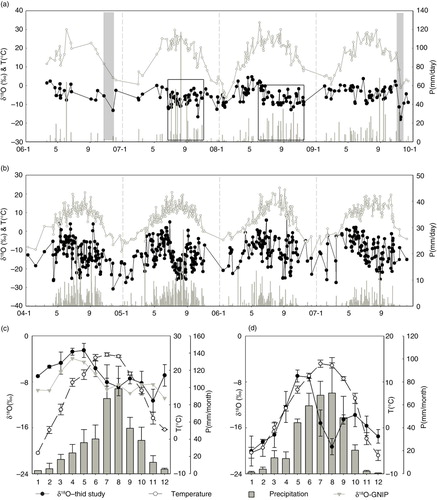
Fig. 3 Correlation of weighted daily δ18O with corresponding temperature (a), precipitation amount (b), relative humidity (c) and surface pressure (d) at both Xi'an (closed dots and black fonts) and Yushu (open dots and blue fonts) throughout the year (upper panels), during monsoon (middle panels) and non-monsoon (lower panels) seasons, respectively, in the 4-yr period.
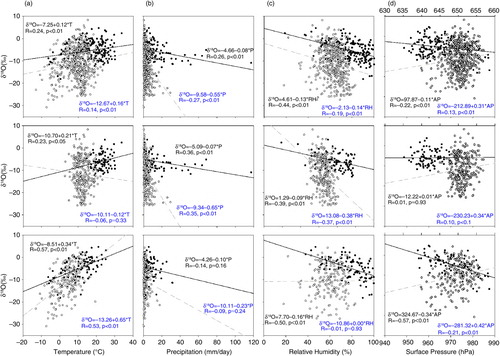
Fig. 4 (a) Time series of normalised daily δ18O in 2007 at selected stations on the Tibetan Plateau; (b) similarity estimation of daily δ18O time series at Yushu to that at Lulang and Lhasa, respectively, using two estimators for sampling at irregular time intervals in 2007; (c) similarity spectral grams of daily δ18O time series at Yushu to that at Lulang as they change with time in 2007, using gXCF. Blue and green lines in (b) refer to results of the correlation analyses for different statistical approaches. The blue lines result from an ESF for extreme events sampled at irregular intervals, while green lines result from the gXCF that is useful to understand the intra-seasonal variation throughout the entire time series. The six columns in (c) refer to six intervals of 60 d for the similarity spectral gram. The lack of sample data at the beginning of the year for both stations leads to missing data (black) in part of the left-most column. The warmer the colour is, the higher the similarity is between time series of the two stations.
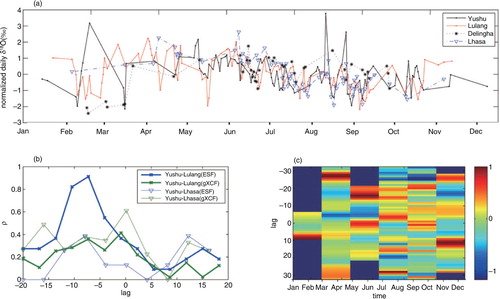
Table 1. Mean and skewness of the inter-sampling time distributions, number of precipitation days, and amount-weighted δ18O during 2007, together with the altitudes of the four stations adopted in the comparative study
Fig. 5 Daily times series of δ18O anomalies in 2007 at Xi'an (a), Guangzhou (b), and Changsha (c), and corresponding wind circulation strength at 850 hPa over East Asia (0–50°N, 100–140°E): U200-zonal wind at 200 hPa representative of the dominating zonal wind strength (Arkin, Citation1982; Ropelewski et al., Citation1992), and V850-meridional wind at 850 hPa indicative of the dominant meridional wind strength.
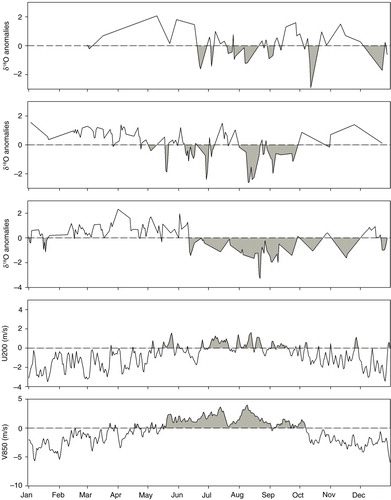
Fig. 6 Monthly variation of δ18O, precipitation amount and temperature in the GNIP dataset (a, b) and our dataset (c). Yellow bars highlight October and November in each year.
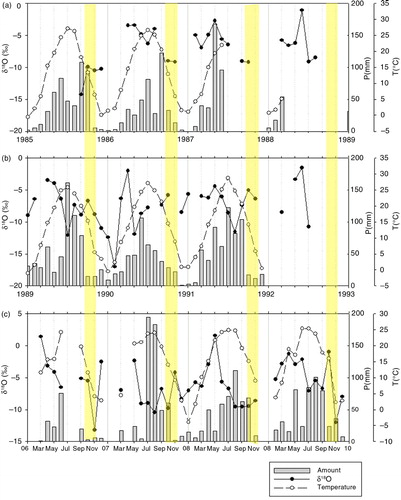
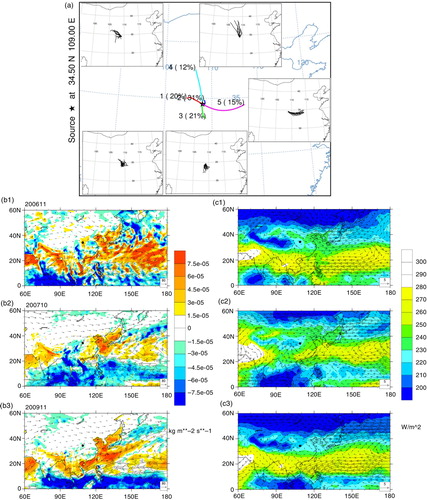
Fig. 7 Atmospheric circulation patterns over East Asia during selected months. (a) Clustered moisture back-trajectory for October and November in 2006–2007 at Xi'an. (b1–b3) Vertically integrated water vapour flux (vector) from the surface to 0 hPa superimposed by the total divergence of water vapour flux (shaded) during November in 2006, October in 2007 and November in 2009 when the most depleted δ18O occur that year. (c1–c3) 850-hPa wind circulation together with OLR during those months. Numbers on the upper left corner of each panel show the month for the circulation map.