Figures & data
Fig. 1 Overview of the measurement sites and the region of interest for this study: AERONET stations (in red), in-situ stations (in green) and CALIPSO ground tracks (grey dashed lines) at distances of less than 250 km from the centre of Stockholm at 59.5°N, 18.0°E. The right side gives a close-up of the Stockholm region with the stations Aspvreten (ASP), Gustav Dalen Tower (GDT), Lilla Essingen (LES), Norr Malma (NOM), SMHI (SMHI), Torkel Knutssonsgatan (TKG) and Uppsala (UPP). The background shows the map of 555-nm AOT as observed by MODIS Aqua during an overpass at 1130 UTC on 22 September 2006. The black grids around the ground sites in the right plots illustrate the 3×3 pixel arrays used for the comparison of ground-based and spaceborne measurements.
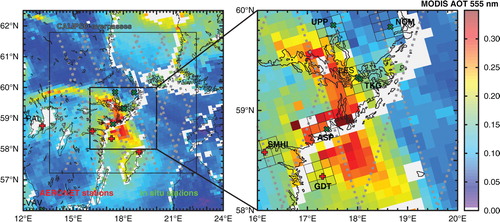
Table 1. In-situ and remote-sensing sites and satellite sensors, locations and areas, and time periods of the observations considered in this study
Table 2. Number of MODIS overpasses for the different ground sites
Fig. 2 Frequency distributions of level 2.0 500-nm AOT measured at four Swedish AERONET sites (a), hourly PM2.5 concentrations measured at the considered stations in the Stockholm region for the entire data sets listed in (b) and for cases that coincide with MODIS overpasses with at least one AOT pixel adjacent to the respective ground sites (c). Numbers in the figure give the amount of cases, mean values with standard deviation, median values and the range of observed values.
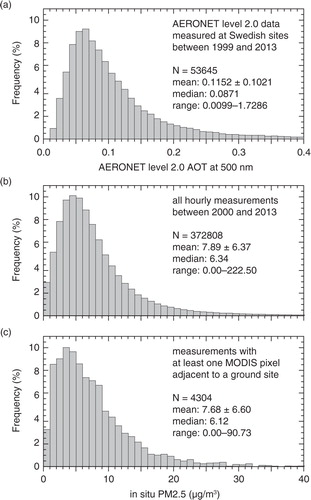
Fig. 3 Monthly resolved overview of the findings of noontime (1117–1157 UTC) CALIPSO overpasses the Stockholm region (250 km around 59.5°N, 18.0°E) in the 8-yr time period from June 2006 to May 2014. The occurrence rates of (a) cloudy and cloud-free lidar profiles and (b) the number of detected aerosol layers during cloud-free conditions are shown. The data were taken from 91 004 individual 5-km profiles provided in the 05kmAPro-Prov-V3-01/V3-02 products.
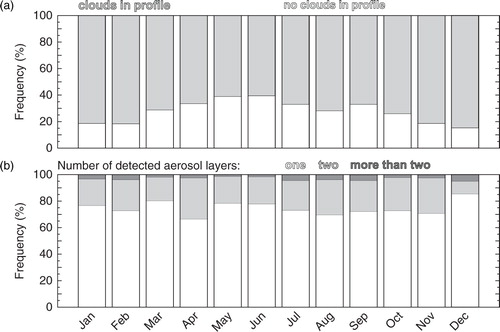
Fig. 4 Comparison of level 2.0 AOT at 555 nm as measured by the AERONET stations Gotland, Gustav Dalen Tower and SMHI and retrieved from MODIS overflights of the stations in the years 2000 to 2013. The time interval for the AERONET observations is ±3 hours around a MODIS overpass. The results are subdivided for (a) individual matches and (b) data binned 0.05 in AERONET AOT. The number of observations per AOT bin in (b) refers to the investigation of all data with observations adjacent to the ground sites (red) and only those with an availability of at least seven out of nine pixels (blue). Dotted black lines mark the expected uncertainty of ±0.05±0.15×AOT of the MODIS retrieval.
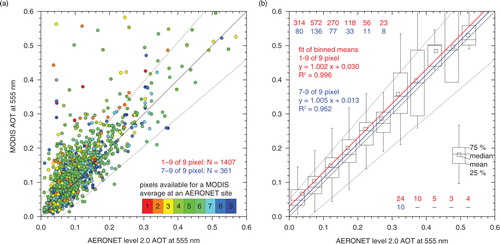
Table 3. Comparison of mean AOT and standard deviation from MODIS (AOTMOD) and AERONET (AOTAER) for different availability of pixels adjacent to a ground site and the number of available cases (N)
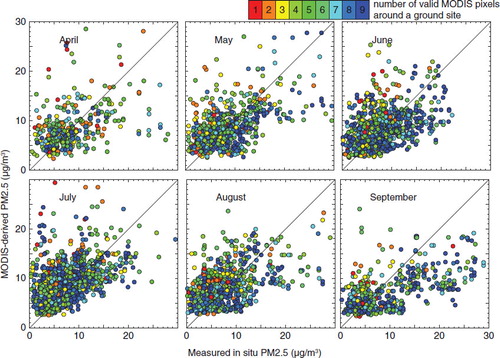
Fig. 5 AOT-to-PM2.5 relationships for (a) the individual in-situ sites listed in and (b) different months using the combined data from the stations in the Stockholm region.
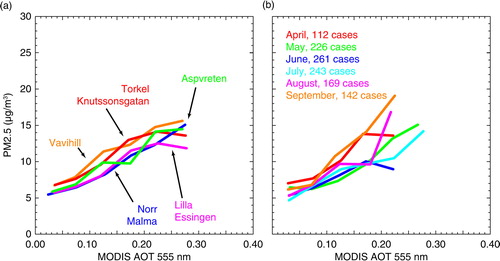
Table 4. Monthly resolved number of available data points for the retrieval of AOT-to-PM2.5 relationships in the Stockholm region based on in-situ observations of particle mass concentration at ASP, LES, NOM, TKG and UPP
Fig. 6 Mean AOT-to-PM2.5 relationship (thick line) obtained for all stations in the Stockholm region (circles). The relationships to estimate lower and upper errors of the PM2.5 estimate are given by the dashed and dotted lines, respectively. The number of cases per AOT bin is given in the bottom of the figure.
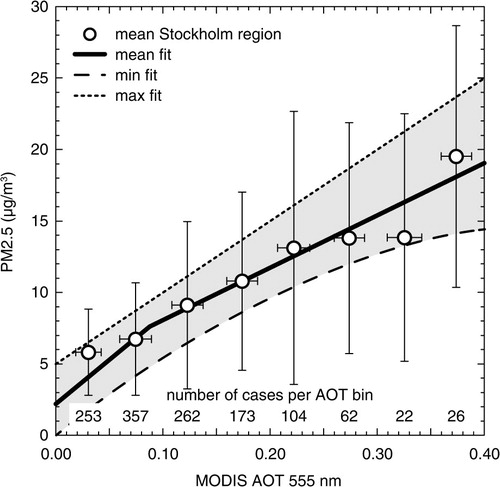
Table 5. Yearly and monthly resolved comparison of in-situ measured and MODIS-derived PM2.5 mass concentrations for all sites in the Stockholm region and for cases that have not been used for the retrieval of the AOT-to-PM2.5 relationships, that is, cases with a pixel coverage of 1, 2, 4, 6, 8 and 9 out of 9
Fig. 7 Time series of hourly PM2.5 at the stations Aspvreten (ASP), Lilla Essingen (LES), Norr Malma (NOM) and Torkel Knutssonsgatan (TKG) for the time period from 9 June 2006 (DoY 160) to 19 July 2006 (DoY 200) as measured in-situ at the ground sites (black lines) and derived from MODIS observations (dots). The colour coding of the dots refers to the number of available MODIS pixels adjacent to a ground site.
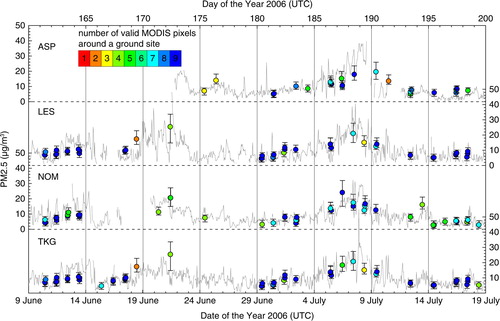
Fig. 8 Satellite scenes of surface PM2.5 in the Stockholm region as obtained from MODIS observations during the time period from 30 June to 12 July 2006. Coloured dots mark the location of the ground sites and corresponding PM2.5 values. Late morning and noon overpasses refer to MODIS on Terra and Aqua, respectively.
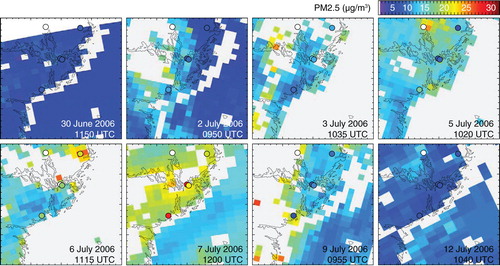
Fig. 9 Same as but for a time period from 22 May 2008 (DoY 143) to 10 June 2008 (DoY 162).
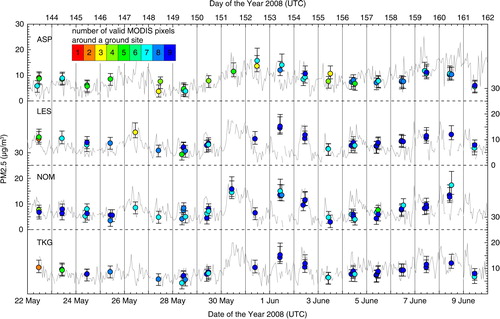
Fig. 10 Satellite scenes of surface PM2.5 in the Stockholm region as obtained by the AOT-to-PM2.5 relationship applied to MODIS observations on 1, 2, 5 and 6 June 2008. The PM2.5 scenes were derived from MODIS Collection 5 (upper row) and Collection 6 (lower row) AOT data. Coloured dots mark the location of the ground sites and corresponding in-situ PM2.5 values.
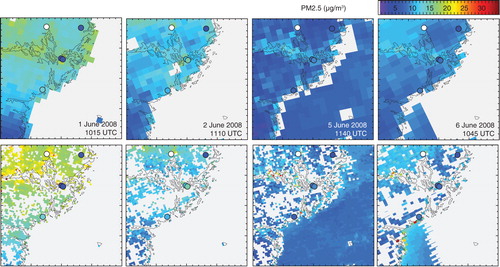
Fig. 11 Monthly correlations of PM2.5 as measured in-situ at ground and derived from MODIS observations in the years from 2000 to 2013. The number of observations per month is given in .