
Figures & data
Fig. 1 Different resolution. Top panel: original (high) resolution, bottom panel: coarse resolution (running mean, leading to a resolution of Δx~100 km).
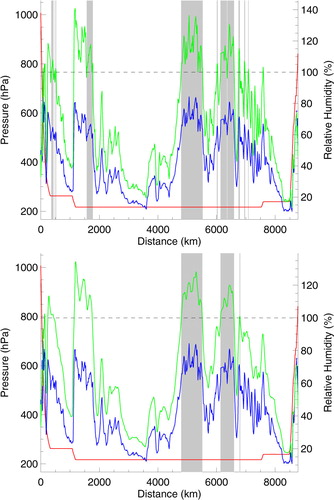
Table 1. Definition of pressure levels for vertical distribution of ISSRs and distances between them
Fig. 2 Pdfs of pathlengths of ISSRs as obtained from data with different resolution (blue: original resolution, red: coarse resolution). (a) Linear binning; (b) logarithmic binning.
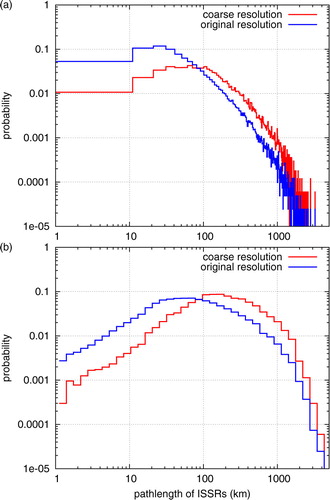
Fig. 3 Weibull plot of pathlengths of ISSRs as obtained from data with different resolution and additional fits. (a) Original resolution; (b) coarse resolution.
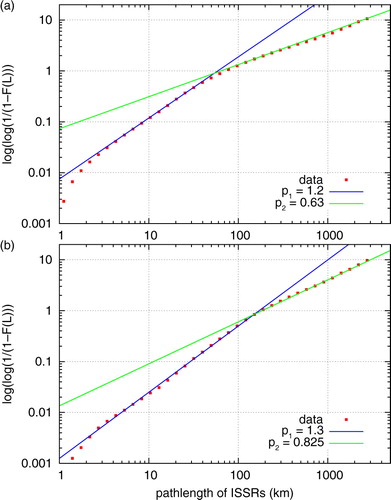
Fig. 4 Pdfs of pathlengths of ISSRs for different regions (blue: extratropics, red: tropics).
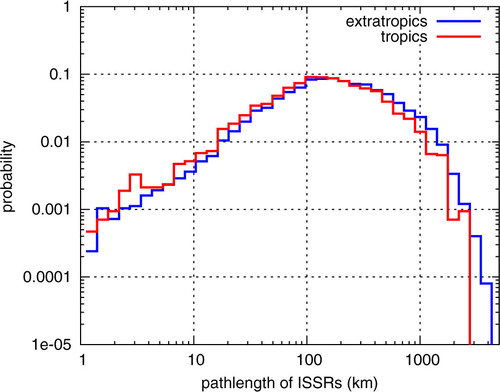
Fig. 5 Cumulative distributions of pathlengths of ISSRs for different seasons as obtained for extratropical data in coarse resolution.
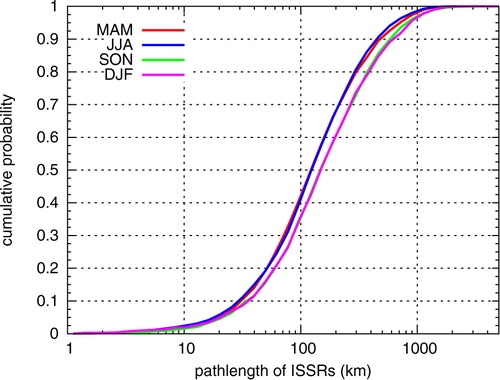
Fig. 6 Median values of pathlengths for different regions, seasons and resolutions. The values can be found in Table
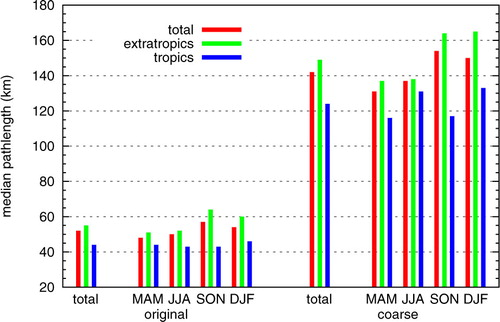
Table 2. Numbers, mean values, standard deviations and median values of pathlengths for different regions and seasons
Fig. 7 Cumulative distributions of pathlengths of ISSRs for different dynamic regimes, i.e. total data separated into troposphere/in between/stratosphere.
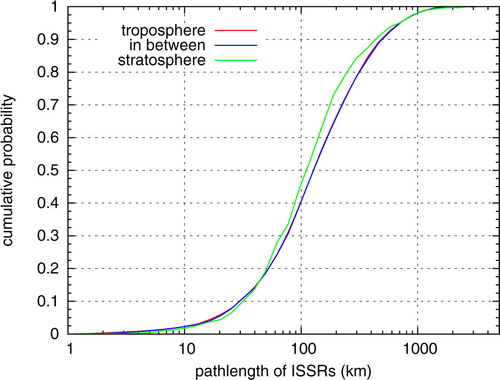
Fig. 8 Seasonal cycle of number of ISSRs as obtained for different dynamic regimes.
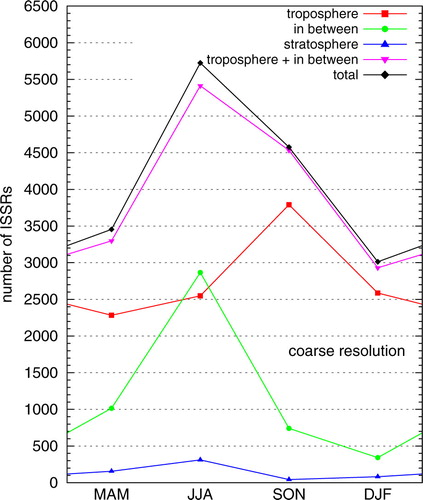
Table 3. Numbers, mean values, standard deviations and median values of pathlengths for different atmospheric levels (troposphere/in between/stratosphere)
Table 4. Numbers, mean values, standard deviations and median values of pathlengths for different vertical pressure levels in both resolutions
Fig. 9 Median values of pathlengths in different dynamic regions, total and seasonal. The values can be found in .
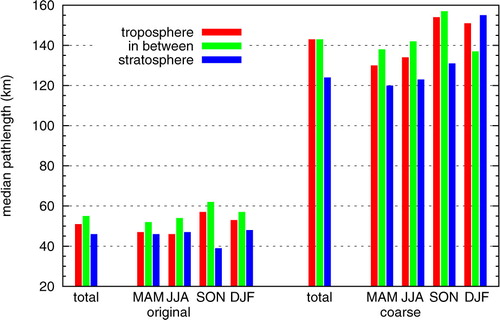
Fig. 10 Pdfs of distances between ISSRs as obtained from data with different resolution (blue: original resolution, red: coarse resolution). (a) Linear binning; (b) logarithmic binning.
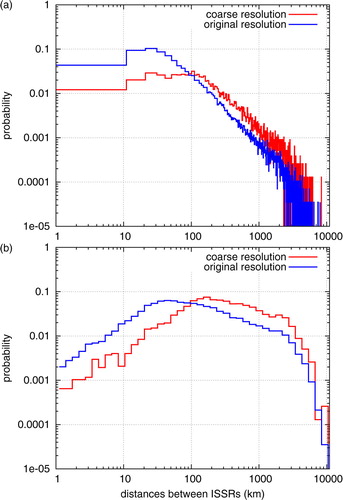
Table 5. Numbers, mean values, standard deviations and median values of distances between ISSRs for different regions and seasons
Fig. 11 Pdfs of distances between ISSRs for different dynamic regimes, i.e. total data separated into troposphere/in between/stratosphere.
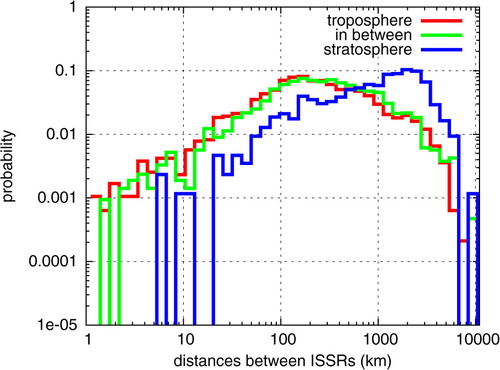
Table 6. Numbers, mean values, standard deviations and median values of distances between ISSRs for different atmospheric levels (troposphere/in between/stratosphere)
Fig. 12 Pathlengths of relative humidity as obtained from the original data for different thresholds RHi t =95/90/80/70 %. (a) Linear binning of the data; (b) logarithmic binning.
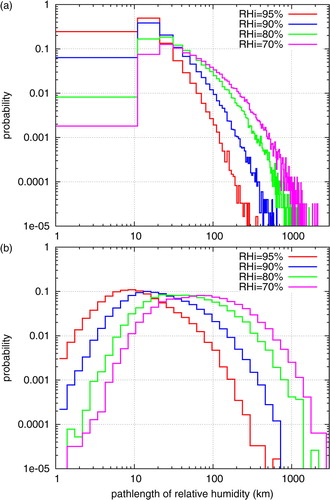
Table 7. Numbers, mean values and standard deviations for pathlengths of RHi until the threshold RHi t is reached. Here, all data in original resolution are used without separation into horizontal or vertical regions
Table 8. Numbers, mean values and standard deviations for pathlengths of RHi until the threshold RHi t is reached. All data in original resolution here are used with separation into different pressure levels
Fig. 13 Example of relative humidity along a simulated flight track. Shown are high-resolution data (red), running mean (blue) and coarse resolution as obtained from running mean data (green) in the interval 50 ≤ x≤300 km.
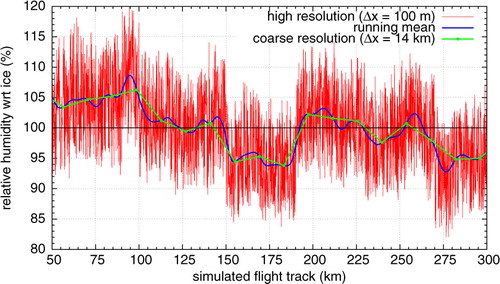
Fig. 14 Variations of different variables (RHi, w, q and T) relevant for the small structure of ISSRs.
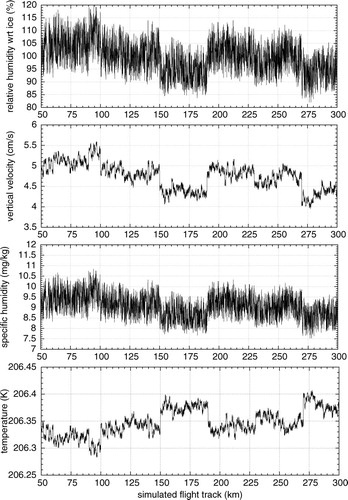
Fig. 15 Vertical temperature profile and adiabatic ascents for the lowest and highest levels occurring in the simulation.
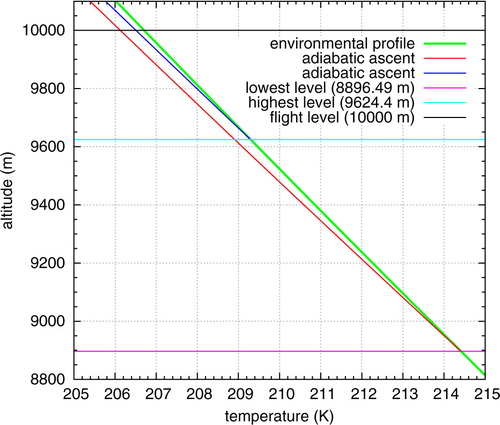
Table 9. Range of variables for start conditions (vertical velocity w and start level z start ) and obtained at flight level z=10000 m (temperature T, relative humidity RHi and specific humidity q) during the simulation
Fig. 16 Correlation between specific humidity and relative humidity for the high-resolution simulation data.
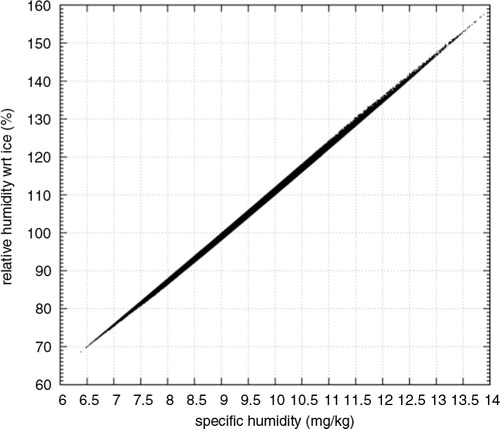
Fig. 17 Pdf of pathlengths of ISSRs as obtained from the high-resolution simulation data (red), running means on coarse binning (blue) and coarse resolution (green).
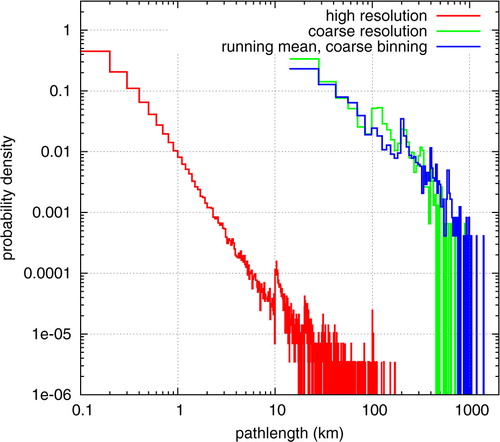
Fig. 18 Pdfs of RHi as obtained from the high-resolution simulation data (red), running means on coarse binning (blue) and coarse resolution (green).
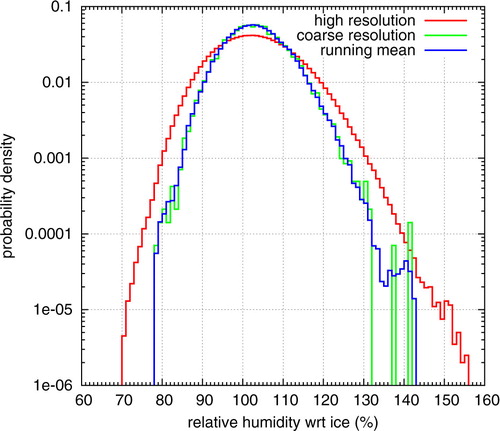
Table 10. Numbers, mean values, standard deviations and median values of pathlengths for different regions and seasons, original resolution
Table 11. Numbers, mean values, standard deviations and median values of pathlengths for different atmospheric levels (troposphere/in between/stratosphere), original resolution
Table 12. Numbers, mean values, standard deviations and median values of distances between ISSRs for different regions and seasons, original data
Table 13. Numbers, mean values, standard deviations and median values of distances between ISSRs for different atmospheric levels (troposphere/in between/stratosphere), original data