Figures & data
Fig. 1 Region of study and sampling sites in East Antarctica. The green boundary in the left map shows the location in Antarctica. At right, an enlarged region shows locations of snow samples. Blue marks spots where several tens of centimetres were extracted, and red marks spots where only freshly fallen surface snow was extracted. The base map is from GMT free software.
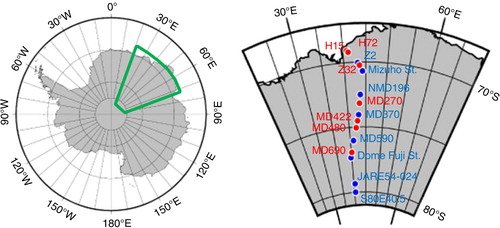
Table 1. Particle sampling sites, their positions and dates
Fig. 2 Elemental distribution of non-volatile particles in surface snow. Each column shows the relative number of particles, at the labelled latitude, having chloride without sodium (light blue), sodium chloride (dark blue), sulphate without sodium (light green), sodium sulphate (dark green) and neither sulphate nor chloride (‘other’, red).
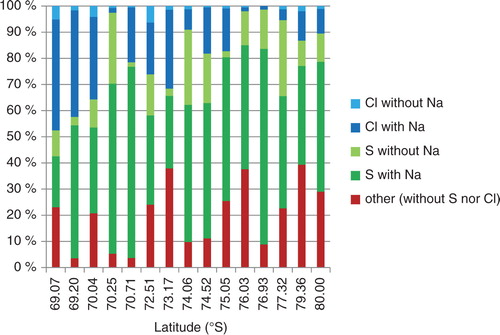
Table 2. Ion concentrations (Cl−, ,
, Na+; µmol L−1) and Cl−/Na+ ratio
Fig. 3 Ternary plots of Na, Cl and S atomic ratios in non-volatile particles by the sublimation–EDS results. Latitude titles are marked as in . Yellow, purple, blue and green circles in the bottom-right diagram (right of the 80°S plot) denote the atomic ratios of bulk seawater, wholly Cl-depleted sea-salt particles with nitrates, wholly Cl-depleted sea-salt particles with sulphates and wholly Cl-depleted sea-salt particles with methane sulphonates, respectively.
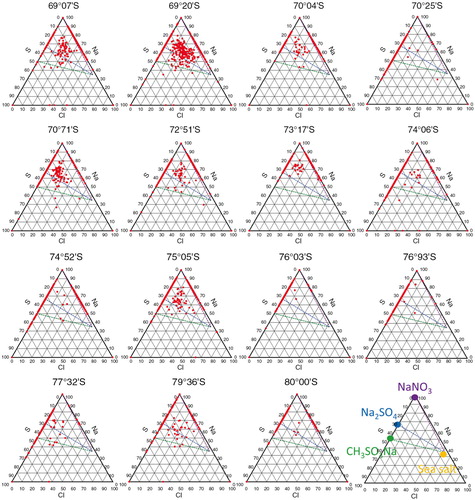
Fig. 4 Number fraction of Na compounds. From the same data as plotted in . Dark blue denotes sea salt. Light blue denotes wholly Cl-depleted sea-salt particles with sulphates and purple denotes partly Cl-depleted sea-salt particles with sulphates. Light green denotes wholly Cl-depleted sea-salt particles with nitrates and brown denotes partly Cl-depleted sea-salt particles with nitrates. The colour order in the data is the same as that in the legend.
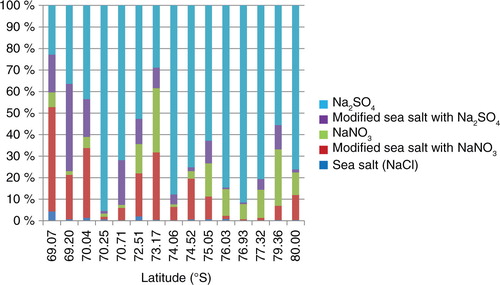
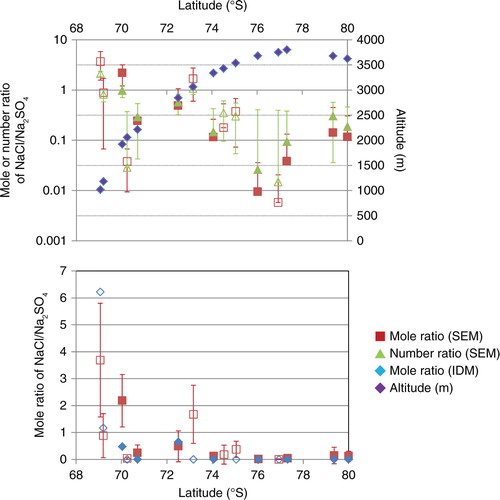
Fig. 5 Mole and number ratios of NaCl/Na2SO4 along the traverse by the ion-deducing method (IDM) and the sublimation–EDS method. Top plot is logarithmic and also shows the altitude (purple diamonds) along the traverse. The bottom plot is the same, except a normal, linear scale. Non-filled white boxes with coloured frame are for summer snow, whereas the filled coloured boxes mean multiyear snow.