
Figures & data
Fig. 1 Map showing the cruise track of the second leg of GasEx-98, where the 3He/SF6 experiment was conducted. The cruise left from Lisbon, Portugal on 25 May 1998, and arrived in Ponta Delgada, Portugal on 26 June 1998.
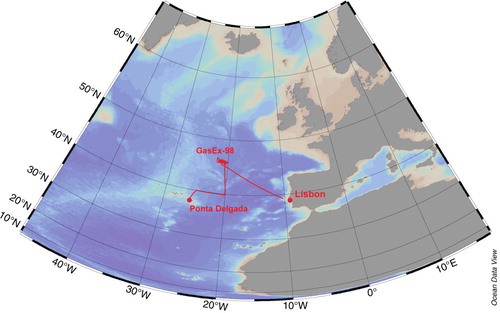
Fig. 2 Wind speeds measured and adjusted to u 10 on the NOAA Ship Ronald H. Brown during GasEx-98. The shaded areas mark the six segments that were used to evaluate the 3He/SF6 data.
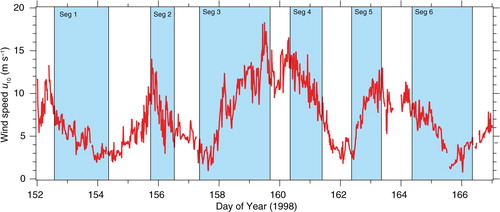
Table 1. Summary of wind speeds and gas transfer velocities from GasEx-98
Fig. 3 Gas transfer velocities for GasEx-98 (filled red circles), corrected to a Schmidt number of 600, plotted along with all published 3He/SF6 derived k(600) values from the coastal and open oceans against wind speed u
10. The 2-week averaged k(600) presented in McGillis et al. (Citation2001a) is also shown (filled red square). The points for GasEx-98 were determined using a least-squares fit to the 3He/SF6 ratios from each of the six segments to determine , and then using eqs. (1 and 2) to calculate k(600). The error estimation for the GasEx-98 data is described in the footnotes to .
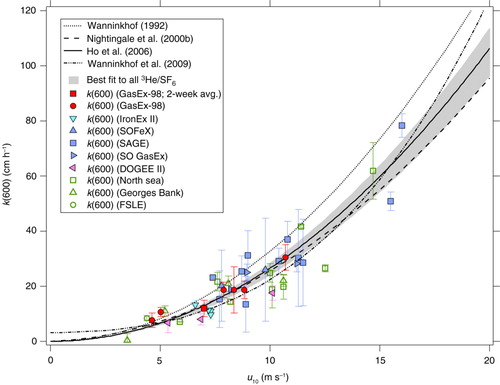
Fig. 4 Observed and modelled 3He/SF6 ratio during GasEx-98. Each data point is the mean of the 3He/SF6 profile from the mixed layer of an individual station, with the error bars representing the standard deviation of 3He/SF6 in the profile. The open symbols are stations that were not used in the analysis, either because they occurred at the beginning of the experiment before the patch has mixed sufficiently (i.e. the first two stations), or because they were deemed to be outside of the tracer patch based on the surface SF6 concentrations.
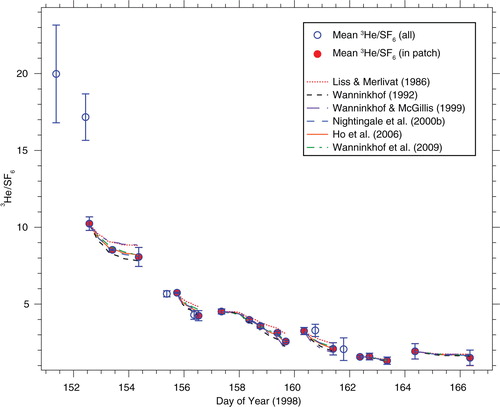
Fig. 5 Model and data comparison of 3He/SF6 ratios for segments 1 and 3 of GasEx-98. For both segments, the parameterisations of Nightingale et al. (Citation2000b), Ho et al. (Citation2006) and Wanninkhof et al. (Citation2009) are most able to model the data.
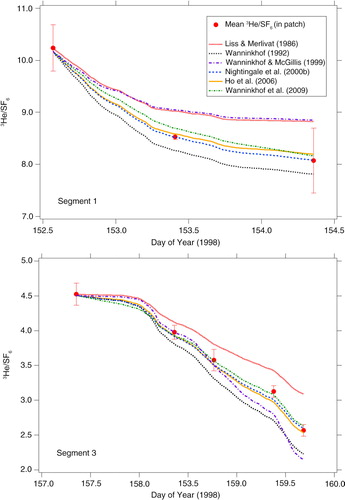
Table 2. Relative root mean square errors of the model/data comparison for each segment of the 3He/SF6 data for each of the parameterizations listed
Fig. 6 Wind speed distributions of segments 1 and 3 of the 3He/SF6 data, shows that segment 1 covered a more narrow range of wind speeds than segment 3, with a mean wind speed that was about half of segment 3.
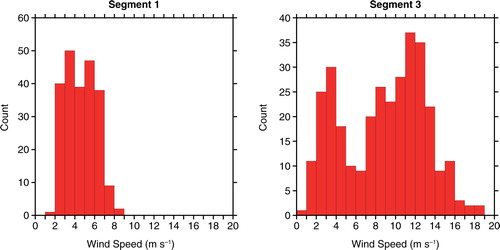
Table 3. Wind speed/gas exchange parameterisations that are able to reproduce the 3He/SF6 results from GasEx-98 and other studies in the coastal and global oceans, and global relationships based on 14C