Figures & data
Fig. 1 Diurnal trend of surface energy fluxes. Measured mean net radiation (R net ), sensible heat flux (H), latent heat flux (LE) and ground heat flux (G) at the peat plateau (left), at the collapsed peat plateau (middle) and at the wet fen (right) during the period June–August 2013.
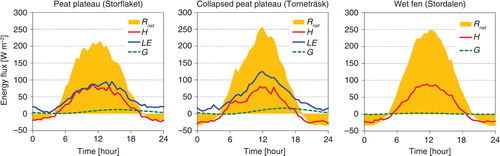
Fig. 2 Mean heat fluxes. Mean sensible heat flux (H), latent heat flux (LE) and ground heat flux (G) at the well-developed peat plateau (left), at the collapsed peat plateau (middle) and at the wet fen (right) in relation to the global solar radiation (R G ). Mean values represent the period June to August 2013 (Storflaket, Torneträsk, Stordalen) and the period January to December 2013 (Stordalen). The error bars represent the standard error. The histogram shows the distribution of the global solar radiation (R G ) in classes of 100 W m−2.
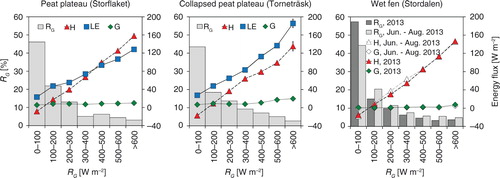
Fig. 3 Mean resistances, Bowen ratio and albedo. Mean surface resistance (Res. s ), atmospheric resistance (Res. a ), Bowen ratio (H/LE) and albedo at the three peatland complexes in relation to the global solar radiation (R G ). The error bars represent the standard error. The histogram shows the distribution of the global solar radiation (R G ) in classes of 100 W m−2.
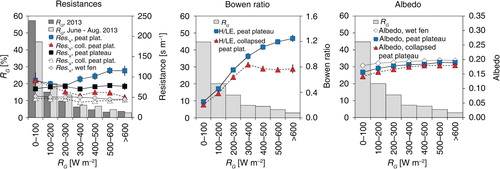
Table 1. Energy balance and environmental characteristics
Fig. 4 Differences in heat fluxes. Differences of mean sensible heat fluxes (ΔH), latent heat fluxes (ΔLE) and ground heat fluxes (ΔG) between the collapsed peat plateau (Torneträsk) and the well-developed peat plateau (Storflaket) (left), between the well-developed peat plateau (Storflaket) and the wet fen (Stordalen) (middle), and between the collapsed peat plateau (Torneträsk) and the wet fen (Stordalen) (right) in relation to the global solar radiation (R G ). The error bars represent the standard error. The histogram shows the distribution of the global solar radiation (R G ) in classes of 100 W m−2.
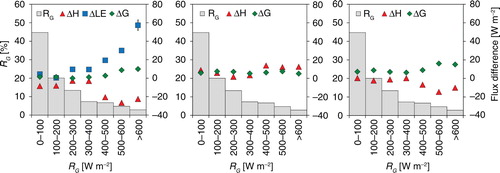
Fig. 5 Energy flux ratios. Mean ratios of sensible heat flux (H) (left), latent heat flux (LE) (middle) and soil heat flux (G) (right) to net radiation (R net ) at the well-developed peat plateau, collapsed peat plateau and wet fen in relation to the global solar radiation (R G ). The error bars represent the standard error. The histogram shows the distribution of the global solar radiation (R G ) in classes of 100 W m−2.
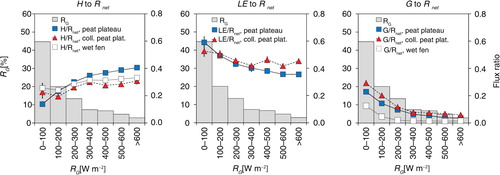
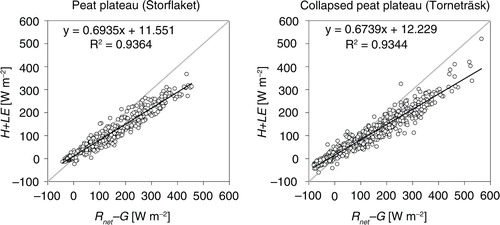
Fig. 6 Energy balance closure. Balance between the turbulent fluxes of sensible and latent heat (H+LE) and the available energy (R net – G) at the peat plateau (left) and at the collapsed peat plateau (right).