
Figures & data
Table 1. Information of study sites
Fig. 1 The direct and indirect effects of climatic variation on the interannual variability (IAV) in net ecosystem exchange (NEE) for evergreen needleleaf forests (a), deciduous broadleaf forests (b), grasslands (c) and croplands (d). Green and red lines represent positive and negative effects, respectively. Solid and dashed lines represent significant (p<0.05) and non-significant (p≥0.05) effects, respectively. The values beside the paths are the standardised (0–1) path coefficients (ρ), which are only shown for significant effects. PAR, photosynthetically active radiation; Ta, air temperature; Ts, soil temperature; VPD, vapour pressure deficit; WBI, water balance index; A m, maximum photosynthetic rate; α, apparent quantum yield; WUE, water use efficiency; R 10, reference respiratory rate at 10 °C; Q 10, temperature sensitivity.
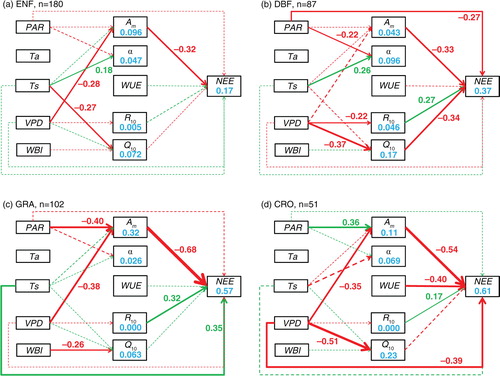
Fig. 2 The direct and indirect effects of climatic variation on in the interannual variability (IAV) in gross primary productivity (GPP) and ecosystem respiration (RE) for evergreen needleleaf forests (a), deciduous broadleaf forests (b), grasslands (c) and croplands (d). Green and red lines represent positive and negative effects, respectively. Solid and dashed lines represent significant (p<0.05) and non-significant (p≥0.05) effects, respectively. The values beside the paths are the standardised (0–1) path coefficients (ρ), which are only shown for significant effects. PAR, photosynthetically active radiation; Ta, air temperature; Ts, soil temperature; VPD, vapour pressure deficit; WBI, water balance index; A m, maximum photosynthetic rate; α, apparent quantum yield; WUE, water use efficiency; R 10, reference respiratory rate at 10 °C; Q 10, temperature sensitivity.
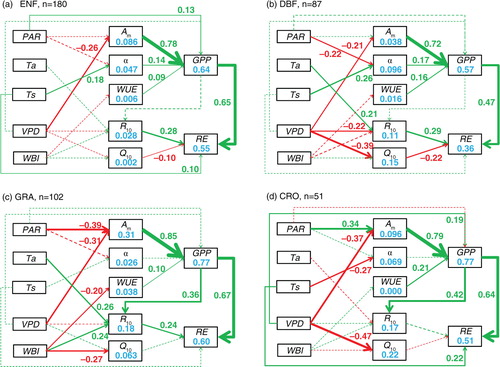
Fig. 3 The direct and indirect effects of climatic variation on the interannual variability (IAV) in net ecosystem exchange (NEE, a–c), gross primary productivity (GPP) and ecosystem respiration (RE, d–f) for wet (water balance index, or WBI, below −500 mm; a, d), moist (−500 mm<WBI<0 mm; b, e), and dry (WBI>0 mm; c, f) ecosystems. Note that a larger WBI indicates a drier environment. Green and red lines represent positive and negative effects, respectively. Solid and dashed lines represent significant (p<0.05) and non-significant (p≥0.05) effects, respectively. The values beside the paths are the standardised (0–1) path coefficients (ρ), which are only shown for significant effects. PAR, photosynthetically active radiation; Ta, air temperature; Ts, soil temperature; VPD, vapour pressure deficit; WBI, water balance index; A m, maximum photosynthetic rate; α, apparent quantum yield; WUE, water use efficiency; R 10, reference respiratory rate at 10 °C; Q 10, temperature sensitivity.
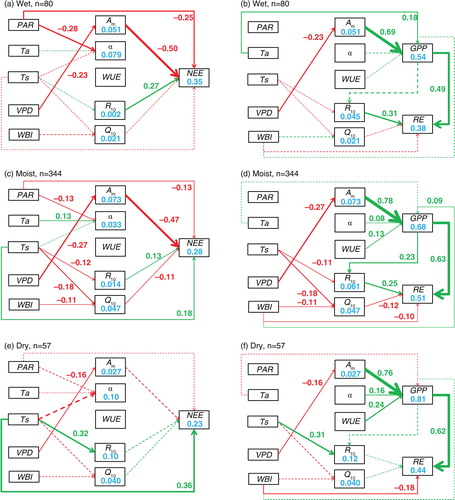
Table 2. Correlation coefficients (r) of the physiological parameters in different ecosystem types