Figures & data
Fig. 1. Administrative division of Fujian province and location of the four sampling sites (solid point in Xiamen, Quanzhou, Putian and Fuzhou).
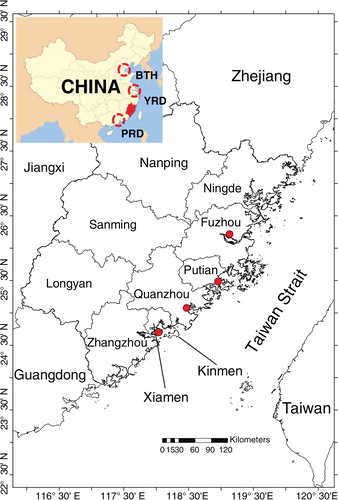
Fig. 2 Temporal variations of LG concentration and rainfall measured at (a) XM, (b) QZ, (c) PT and (d) FZ sites during the eight sampling periods. The two orange dashed bars represent high biomass burning activities around the traditional Ching-Ming festival.
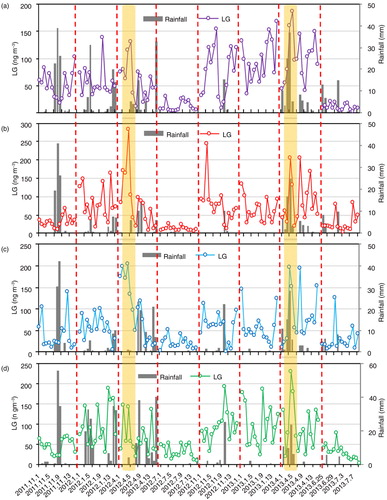
Fig. 3 Variations of LG and K+ average concentrations and MODIS fire counts in Fujian province.
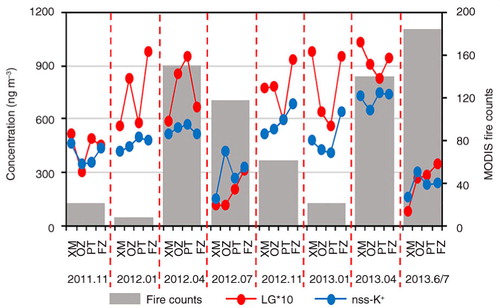
Fig. 4 Correlations between LG and nss-K+ for all samples at each site.
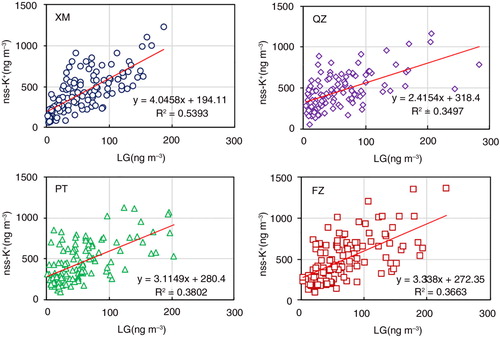
Fig. 5 (a) Seasonal variations of WSOC concentration, and ratios of (b) LG/nss-K+, (c) WSOC/OC, (d) SOC/OC, (e) LG/OC, (f) LG/WSOC, (g) OCBB/OC and (h) WSOCBB/WSOC in PM2.5 at the four urban sites.
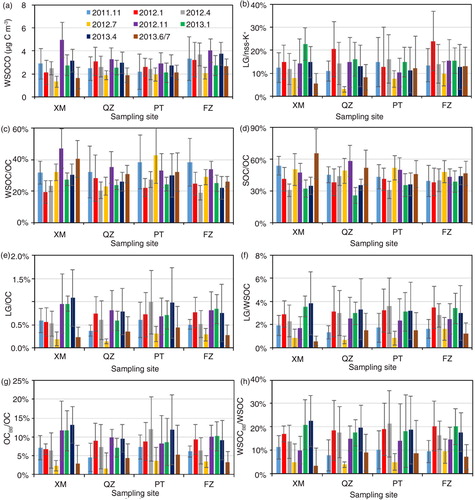
Table 1. Correlation coefficient between species (n=60)
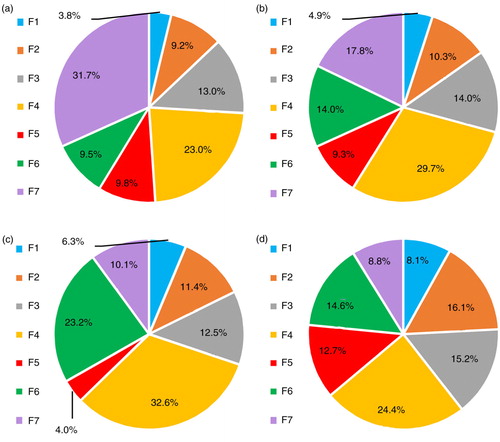
Fig. 6 (a) Mass contributions and (b) relative mass contributions of biomass burning on PM2.5 between LG-predicted and PMF-predicted analysis.
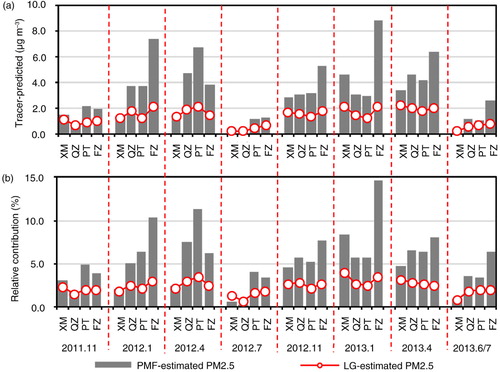
Fig. 7 Pie-charts showing the source apportionment of PM2.5 at (a) XM, (b) QZ, (c) PT and (d) FZ. The sources include biomass burning (F1), fuel oil (F2), vehicular emission (F3), secondary nitrate and sulphate aerosol (F4), crustal dust (F5), metallurgical emission at XM and QZ or mixed source of metallurgical emission and secondary sulphate aerosol at PT and FZ (F6), secondary sulphate and organic aerosol at XM and QZ or waste incineration emission at PT and FZ (F7).