
Figures & data
Fig. 1 Seven-day isentropic air mass back trajectories (AMBTs) computed using hybrid single particle Lagrangian-integrated trajectory model, HYSPLIT-4 (Draxler et al., Citation1999) for the sampling days (27 December 2008 to 26 January 2009) along the cruise track in the Bay of Bengal. Blue pins and red dots over the Indo-Gangetic Plain represent the locations of coal-fired power plants and MODIS-derived fire spots, respectively.
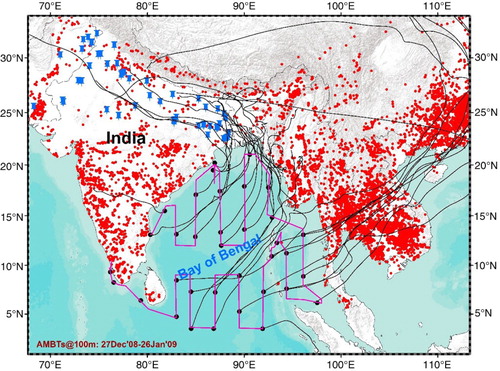
Table 1. Statistical description of mass concentrations (in µg m−3) of chemical constituents and stable carbon and nitrogen isotopic compositions (δ15N and δ13C) in PM2.5 collected over the Bay of Bengal during January 2009
Fig. 2 (a) Comparison of mass concentrations of total carbon (TC) measured by elemental analyser coupled to isotope ratio mass spectrometer (EA-irMS) versus estimated TC concentration based on the atmospheric abundances of elemental and organic carbon (as EC+OC, measured on Sunset Carbon Analyzer), and (b) correlation plot between total nitrogen (TN) measured by EA-irMS and water-soluble inorganic nitrogen (i.e.
![]()
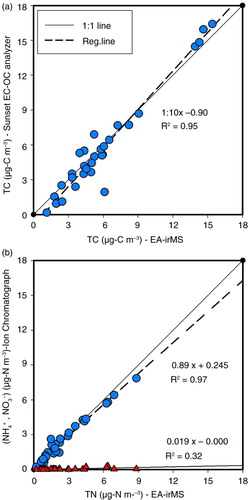
Fig. 3 Spatial distributions of (a) stable carbon (δ13CTC) and (b) nitrogen (δ15NTN) isotopic composition of fine mode (PM2.5) aerosols collected from the marine atmospheric boundary layer of the Bay of Bengal during a winter cruise (27 December 2008 to 28 January 2009).
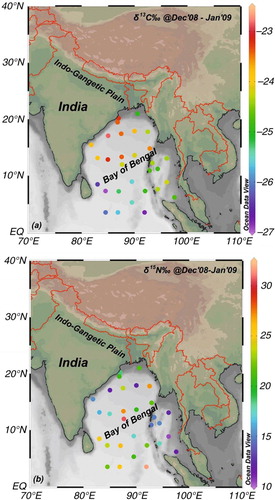
Fig. 4 Correlation plots for (a) TN versus δ15NTN, (b) TC versus δ13CTC, (c) nss-K+ versus δ13CTC and (d) WSOC versus δ13CTC for fine mode aerosols collected over the Bay of Bengal during a winter cruise (27 December 2008 to 28 January 2009).
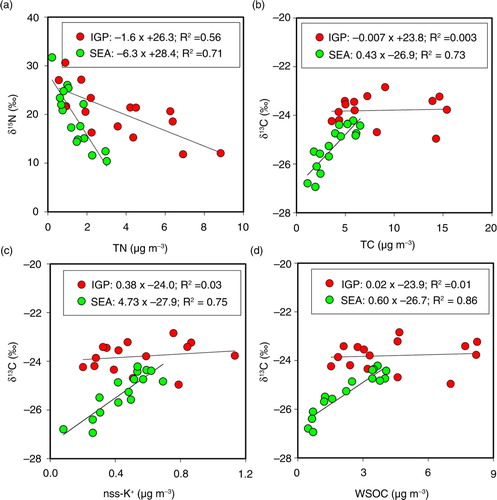
Fig. 5 Comparison of δ13C of aerosol-TC over the BoB during a winter cruise (January 2009) with literature values of various sources such as combustion/emissions from C3, C4 and marine phytoplankton (Turekian et al., Citation1998; Cao et al., Citation2013), coal combustion (Mori et al., Citation1999; Widory, Citation2006) and vehicular emissions (Widory, Citation2006; Cao et al., Citation2013).
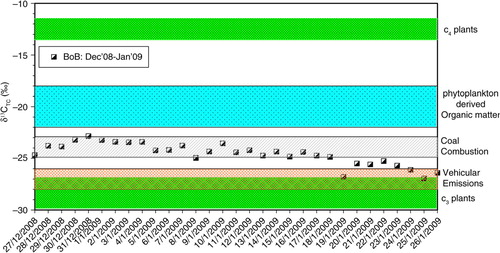
Fig. 6 Linear regression analysis between (a) concentration of
![]()
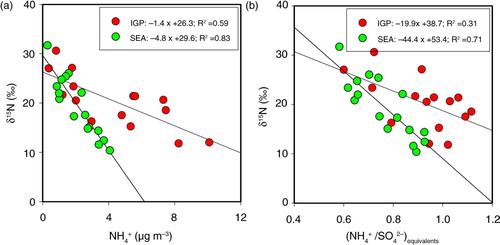
Table 2. Comparison of stable carbon and nitrogen isotopic compositions of aerosols from this study with those documented in the literature over South Asia