
Figures & data
Fig. 1. Possible patterns of growth of individuals of A. gallica: Model 1. Under Model 1 a unique individual is established through mating and then grows vegetatively to occupy a space, often including many adjacent tree root systems. The dots represent mutations that leave behind mutant sectors. Model 2 is an extension of Model 1; after an individual colonizes a space, it remains in place, but localized patches may die off or serve as inoculum for recolonization of newly available substrates. Under Model 3, any given genotypic sector diffuses outward and becomes spatially mixed with other genotypes of the same individual, thus degrading the spatial signatures of Models 1 and 2. None of the three models is mutually exclusive of any of the other models.
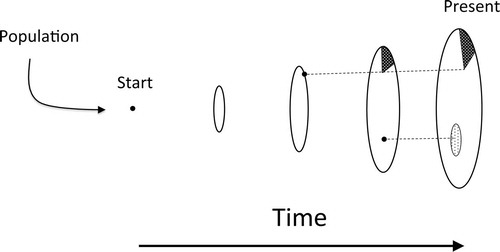
Table I. Primers and genomic sequences used in genotyping individuals of A. gallica
Table II. Sequence polymorphisms distinguishing individuals of A. gallica
Table III. SNPs in Ar9 and Ar14, relative to the reference Ar7
Table IV. Primers for detecting SNPs within Individual 1
Fig. 2. Exploded map of genotype sectors on the collection site, Exe Island, Portland, Ontario. The changes associated with the genotype network are provided ().
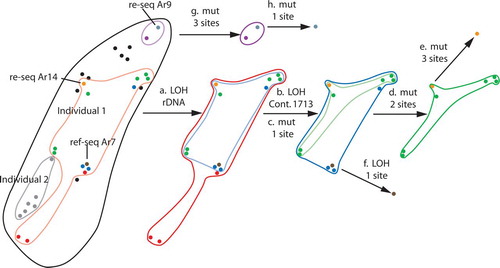
Table V. Changes in the genotype network