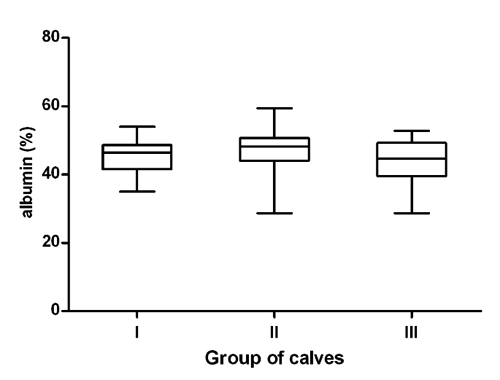
Figure 1. Distribution of the relative concentrations of albumin in the evaluated groups of calves. The plot shows the median (line within box), 25th and 75th percentiles (box), minimal and maximal values (whiskers).
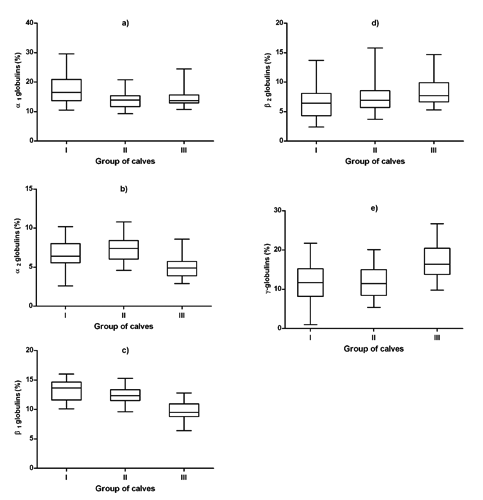
Figure 2. Distribution of the relative concentrations of α1- (a), α2 - (b), β1- (c), β2 - (d) and γ-globulins (e) in the evaluated groups of calves. The plots show the median (line within box), 25 and 75 percentiles (box), minimal and maximal values (whiskers).
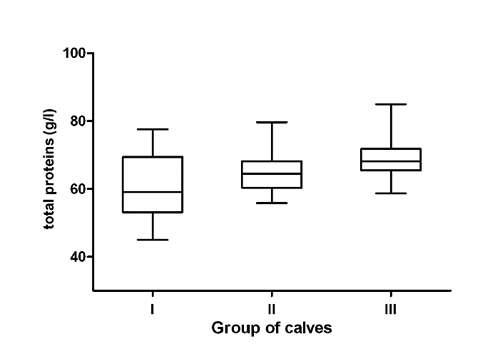
Figure 3. Distribution of the concentrations of total proteins in the evaluated groups of calves. The plot shows the median (line within box), 25th and 75th percentiles (box), minimal and maximal values (whiskers).
Table 1. Concentrations of total proteins, serum protein fractions and albumin/globulin ratios in the evaluated age and nutritional groups of calves (mean±SD).