7,934
Views
195
CrossRef citations to date
0
Altmetric
Review

The place of diatoms in the biofuels industry

, , , &
Pages 221-240 | Published online: 09 Apr 2014

Figures & data

Figure 1.  Scanning electron micrographs of different diatom species.

(A) Thalassiosira pseudonana, (B)Cocconeis sp., (C)Lampriscus sp., (D)Gyrosigma balticum, (E)Cyclotella cryptica, (F)Nitzschia sp., (G)Thalassiosira weissflogii and (H)Achnanthes sp.
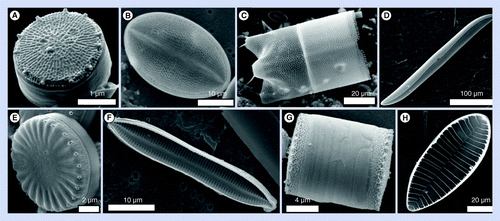
Figure 1.  Scanning electron micrographs of different diatom species. (A) Thalassiosira pseudonana, (B)Cocconeis sp., (C)Lampriscus sp., (D)Gyrosigma balticum, (E)Cyclotella cryptica, (F)Nitzschia sp., (G)Thalassiosira weissflogii and (H)Achnanthes sp.
Figure 2.  Fluorescence and light micrographs of lipid droplets in diatoms.

(A) Nitzschia curvilineata, (B)Cyclotella cryptica, (C)C. cryptica, (D)Nitzschia alba and (E)Nitzschia filiformis. Green fluorescence is BODIPY staining of neutral lipids, red is chlorophyll autofluorescence. (B) is a differential interference contrast image with no fluorescence.
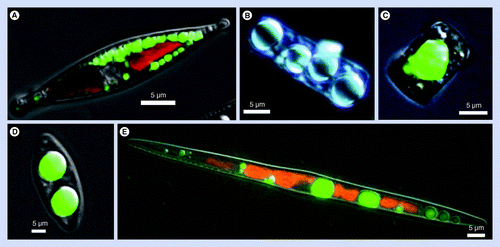
Figure 2.  Fluorescence and light micrographs of lipid droplets in diatoms. (A) Nitzschia curvilineata, (B)Cyclotella cryptica, (C)C. cryptica, (D)Nitzschia alba and (E)Nitzschia filiformis. Green fluorescence is BODIPY staining of neutral lipids, red is chlorophyll autofluorescence. (B) is a differential interference contrast image with no fluorescence.
Figure 3.  Unrooted consensus phylogeny of photosynthetic eukaryotes and derived taxa.

Branch lengths do not correspond to phylogenetic distances. Red arrow locates diatoms and green arrow locates chlorophytes.

Reproduced with permission from Citation[176].

Figure 3.  Unrooted consensus phylogeny of photosynthetic eukaryotes and derived taxa.Branch lengths do not correspond to phylogenetic distances. Red arrow locates diatoms and green arrow locates chlorophytes.Reproduced with permission from Citation[176].
Figure 4.  Neutral lipid accumulation using BODIPY fluorescence in Thalassiosira pseudonana comparing treatment with nocodazole, or limitation for Si or N.

Cultures were harvested from exponential phase and inoculated into fresh medium for the various treatments. The nocodazole treatment was done in a separate experiment from Si and N.
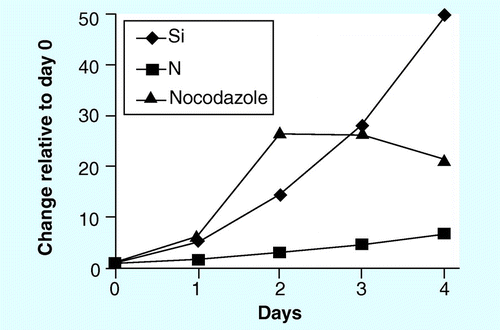
Figure 4.  Neutral lipid accumulation using BODIPY fluorescence in Thalassiosira pseudonana comparing treatment with nocodazole, or limitation for Si or N.Cultures were harvested from exponential phase and inoculated into fresh medium for the various treatments. The nocodazole treatment was done in a separate experiment from Si and N.
Figure 5.  Control of biomass accumulation in cultures of Cyclotella cryptica by altering the starting concentration of silicon.

Incremental amounts of silicic acid were added to the cultures at day 1 and growth followed thereafter. On day 7 when all cultures were limited, the ratio of cell numbers to starting concentration were in exact correspondence.
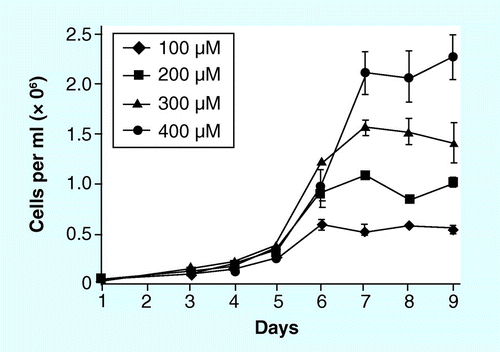
Figure 5.  Control of biomass accumulation in cultures of Cyclotella cryptica by altering the starting concentration of silicon.Incremental amounts of silicic acid were added to the cultures at day 1 and growth followed thereafter. On day 7 when all cultures were limited, the ratio of cell numbers to starting concentration were in exact correspondence.

Reprints and Corporate Permissions

Please note: Selecting permissions does not provide access to the full text of the article, please see our help page How do I view content?

To request a reprint or corporate permissions for this article, please click on the relevant link below:

Academic Permissions

Please note: Selecting permissions does not provide access to the full text of the article, please see our help page How do I view content?

Obtain permissions instantly via Rightslink by clicking on the button below:

If you are unable to obtain permissions via Rightslink, please complete and submit this Permissions form. For more information, please visit our Permissions help page.