2,492
Views
45
CrossRef citations to date
0
Altmetric
Review

Energy innovation potential of oleaginous microalgae

, , &
Pages 761-781 | Published online: 09 Apr 2014

Figures & data

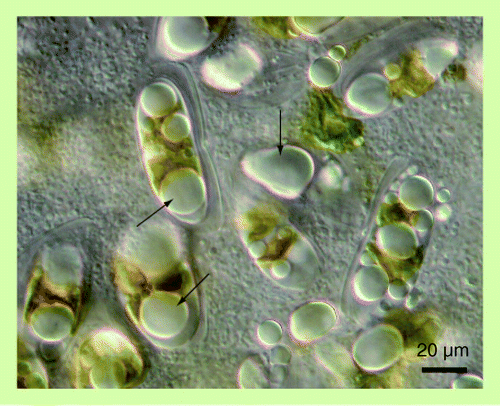
Figure 1.  Diatom cells including lipid bodies (shown by arrows) in their cytoplasm.
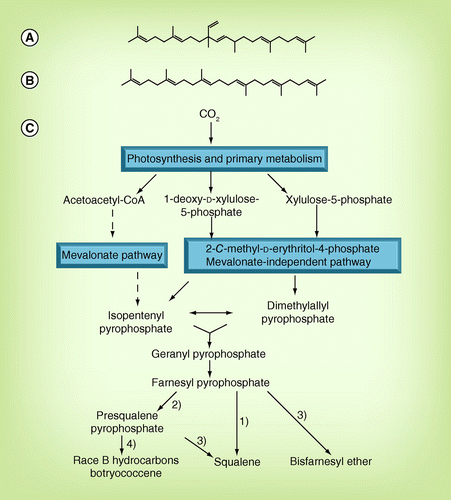
Figure 2.  Hydrocarbon molecules produced by the chemical race B of Botryococcus braunii and Aurantiochytrium.

(A) C30 botryococcene, (B) squalene and (C) main biosynthetic pathway of botryococcene and squalene. 1) Squalene synthase gene, BSS; 2) squalene synthase-like gene, SSL-1; 3) squalene synthase-like gene, SSL-2; 4) squalene synthase-like gene, SSL-3.

CoA: Coenzyme A.

Figure 2.  Hydrocarbon molecules produced by the chemical race B of Botryococcus braunii and Aurantiochytrium. (A) C30 botryococcene, (B) squalene and (C) main biosynthetic pathway of botryococcene and squalene. 1) Squalene synthase gene, BSS; 2) squalene synthase-like gene, SSL-1; 3) squalene synthase-like gene, SSL-2; 4) squalene synthase-like gene, SSL-3.CoA: Coenzyme A.
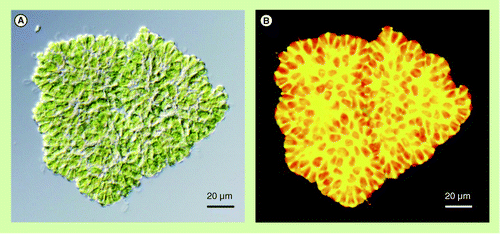
Figure 3.  Oil-accumulating colony of Botryococcus braunii (race B).

(A) Differential interference contrast microscopy. (B) Fluorescence microscopy of Nile red-stained colony. Nonpolar lipids including botryococcene show bright yellow fluorescence. Red fluorescence is autofluorescence derived from chlorophylls in chloroplasts.

Figure 3.  Oil-accumulating colony of Botryococcus braunii (race B). (A) Differential interference contrast microscopy. (B) Fluorescence microscopy of Nile red-stained colony. Nonpolar lipids including botryococcene show bright yellow fluorescence. Red fluorescence is autofluorescence derived from chlorophylls in chloroplasts.
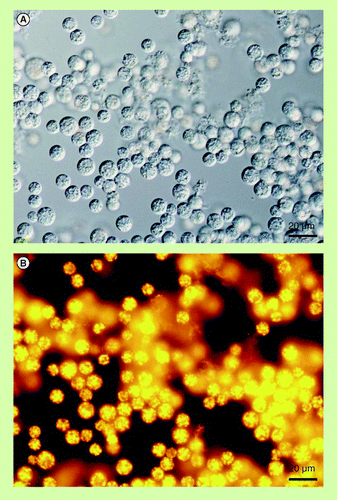
Figure 4.  Oil-accumulating cells of Aurantiochytrium sp. strain 18W-13a.

(A) Differential interference contrast microscopy. (B) Fluorescence microscopy of Nile red-stained cells. Yellow fluorescence indicates nonpolar lipids including squalene. Peripheral red fluorescence indicates phospholipids, the major component of the cell membrane.

Figure 4.  Oil-accumulating cells of Aurantiochytrium sp. strain 18W-13a. (A) Differential interference contrast microscopy. (B) Fluorescence microscopy of Nile red-stained cells. Yellow fluorescence indicates nonpolar lipids including squalene. Peripheral red fluorescence indicates phospholipids, the major component of the cell membrane.
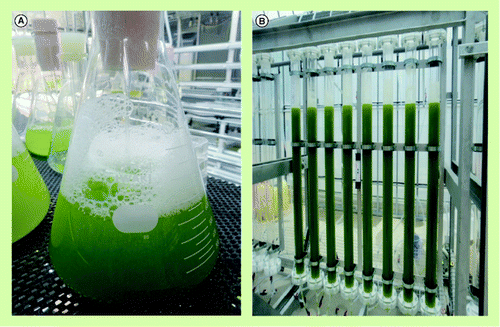
Figure 5.  Cultures of Botryococcus.

(A) Laboratory-scale seed culture. (B) The 480-l-scale tube bioreactor system.

Figure 5.  Cultures of Botryococcus. (A) Laboratory-scale seed culture. (B) The 480-l-scale tube bioreactor system.
Figure 6.  World energy demand and oil supply potential of algal plants.

Traditional fuel includes oil, gas and coal. Traditional biofuels include oil and alcohol from rapeseeds, corn, palm oil and sugarcane.

Reproduced with permission from Citation[76].

Figure 6.  World energy demand and oil supply potential of algal plants.Traditional fuel includes oil, gas and coal. Traditional biofuels include oil and alcohol from rapeseeds, corn, palm oil and sugarcane.Reproduced with permission from Citation[76].

Table 1.  Oil-producing algae.

Table 2.  Biomass and lipid productivities of microalgae cultured in wastewaters.
Reprints and Corporate Permissions

Please note: Selecting permissions does not provide access to the full text of the article, please see our help page How do I view content?

To request a reprint or corporate permissions for this article, please click on the relevant link below:

Academic Permissions

Please note: Selecting permissions does not provide access to the full text of the article, please see our help page How do I view content?

Obtain permissions instantly via Rightslink by clicking on the button below:

If you are unable to obtain permissions via Rightslink, please complete and submit this Permissions form. For more information, please visit our Permissions help page.