Figures & data
Table 1. Various concepts to normalize concentration of standard.
Table 2. Example for normalization concept A.
Table 3. Example for normalization concept B.
Table 4. Example for normalization concept C.
Comparing incurred matrix samples measured against new and old calibration curves by linear regression analysis. The slope of 0.862 was obtained from the linear regression analysis. In this case, the original label concentration of the new lot would be multiplied by a factor of 1.16 (1/0.862).
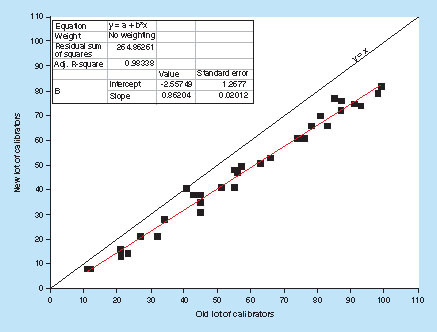
Table 5. Experimental approaches to guarantee long-term comparability of calibration standards.
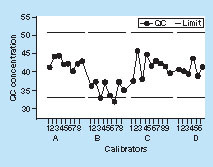
Quality controls failed after the switch to a new calibration standard lot B as they exceeded acceptance limits. Using a normalization concept runs measured versus lot B would have passed.