
Figures & data
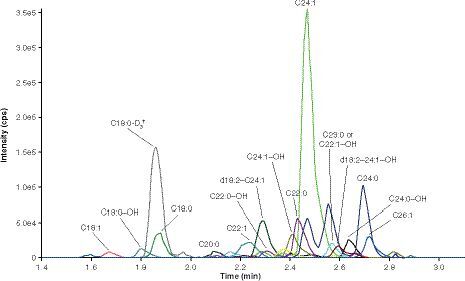
The 15 sulfatide species at the LLOQ (0.020 μg/ml) that comprised the assessment of total sulfatide levels from samples.
†Internal standard (C18:0-D3-sulfatide) at the spiking concentration (50 ng/ml).
cps: Counts per second.
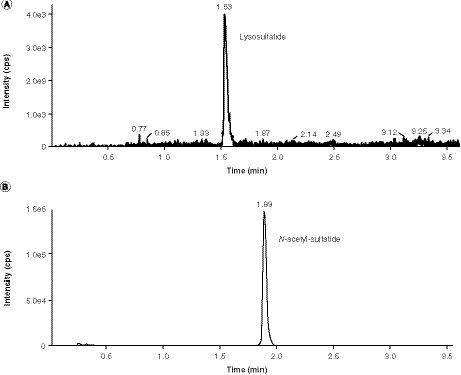
(A) Lysosulfatide at the LLOQ (0.02 ng/ml). (B) Internal standard (N-acetyl-sulfatide) at the spiking concentration (50 ng/ml).
cps: Counts per second.
(A) First run of cerebrospinal fluid sulfatides assay. (B) First run of cerebrospinal fluid lysosulfatide assay.
IS: Internal standard.
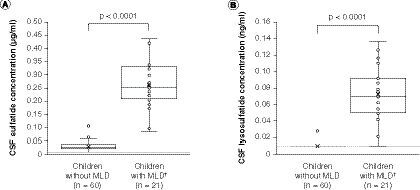
(A) Sulfatides. (B) Lysosulfatide. Sulfatide concentrations were below the limit of quantification, defined as half of the LLOQ value (0.0103 μg/ml; panel A dashed line) after factoring in the volume change in final solution, in 13 of the 60 CSF samples from children without MLD, and lysosulfatide concentrations were below the limit of quantification (0.0103 ng/ml; panel B dashed line) in 59 of the 60 CSF samples from children without MLD, skewing the distribution of these box and whisker plots. For children with MLD, none of the CSF sulfatide concentrations were below the limit of quantification and one CSF lysosulfatide concentration was below the limit of quantification. The data points above the plot for children without MLD may be considered outliers; however, an outlier analysis was not performed. P-values are for two-sample t-tests for differences between mean values (denoted as crosses) between children without MLD and children with MLD.
†Concentrations for children with MLD are baseline concentrations.
CSF: Cerebrospinal fluid; MLD: Metachromatic leukodystrophy.
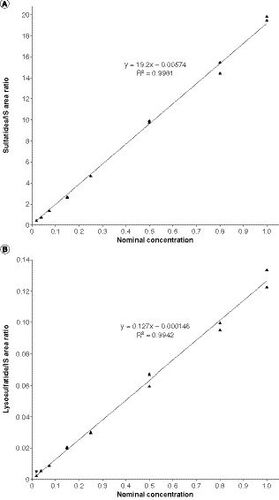
(A) Baseline CSF sulfatide levels. (B) Baseline CSF lysosulfatide levels. P-values are based on Spearman’s correlation tests.
CSF: Cerebrospinal fluid; GMFM-88: Gross Motor Function Measure-88.
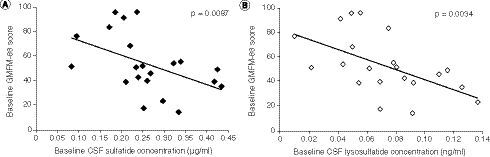
Table 1 Mass transition and elution times for the 19 sulfatide species monitored by the cerebrospinal fluid sulfatides assay.
Table 2 Intra- and interday accuracy (%bias) and precision (%CV) using the sulfatide and lysosulfatide quality controls in human cerebrospinal fluid.
Supplemental Material
Download MS Word (162.5 KB)Supplemental Material
Download MS Word (14.1 KB)Data sharing statement
The authors certify that this manuscript reports the secondary analysis of clinical trial data that have been shared with them, and that the use of this shared data is in accordance with the terms (if any) agreed upon their receipt. The source of this data is NCT01510028. Shire (a Takeda company) does not plan to share data supporting the results reported in this article as there is a reasonable likelihood that individual patients could be re-identified (due to the limited number of study participants/study sites).