1,266
Views
0
CrossRef citations to date
0
Altmetric
Research Article

Inductively Coupled Plasma Mass Spectrometry Method for Plasma and Intracellular Antimony Quantification Applied to Pharmacokinetics of Meglumine Antimoniate

ORCID Icon, , , , , , & ORCID Icon show all
Pages 655-667 | Received 14 Jan 2021, Accepted 17 Mar 2021, Published online: 08 Apr 2021

Figures & data

Figure 1. Proposed meglumine antimoniate chemical structure.

Proposed structural formula for meglumine antimoniate (364 Da) in aqueous solution.

Adapted with permission from [Citation23].

Figure 1. Proposed meglumine antimoniate chemical structure.Proposed structural formula for meglumine antimoniate (364 Da) in aqueous solution.Adapted with permission from [Citation23].
Figure 2. Representative calibration curve for antimony in human plasma.

Calibration standards for antimony (25, 50, 250, 500, 2500, 5000, 7500 and 10000 ng/ml) were quantified using inductively coupled plasma mass spectrometry and calibration was fitted with a linear model based on weighting of 1/concentration2. This calibration was obtained from the analytical run 1 and processed with the software Watson LIMS version 7.5 SP1.

Figure 2. Representative calibration curve for antimony in human plasma.Calibration standards for antimony (25, 50, 250, 500, 2500, 5000, 7500 and 10000 ng/ml) were quantified using inductively coupled plasma mass spectrometry and calibration was fitted with a linear model based on weighting of 1/concentration2. This calibration was obtained from the analytical run 1 and processed with the software Watson LIMS version 7.5 SP1.
Figure 3. Antimony plasma and intracellular concentration–time curves.

(A–E) Pharmacokinetic curves for antimony plasma and intracellular (peripheral blood mononuclear cell) levels. Samples were procured from five patients undergoing antileishmanial therapy with meglumine antimoniate. Samples were collected during the last day of treatment (day 20) and evaluated up to 24 h following drug administration.

Figure 3. Antimony plasma and intracellular concentration–time curves. (A–E) Pharmacokinetic curves for antimony plasma and intracellular (peripheral blood mononuclear cell) levels. Samples were procured from five patients undergoing antileishmanial therapy with meglumine antimoniate. Samples were collected during the last day of treatment (day 20) and evaluated up to 24 h following drug administration.

Table 1. Clinical characteristics of cutaneous leishmaniasis patients.

Table 2. Agilent 7700x operating parameters.

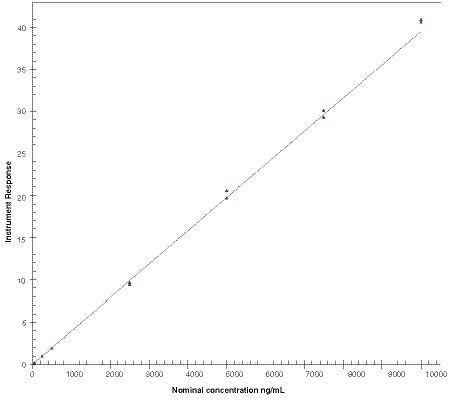
Table 3. Calibration curve regression parameters for antimony.

Table 4. Back-calculated calibration standards for antimony in human plasma.

Table 5. Accuracy and precision of antimony in human plasma.

Table 6. Accuracy and precision of antimony in human peripheral blood mononuclear cells.

Table 7. Validated methods for antimony quantification in human samples.