Figures & data
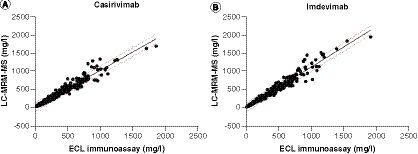
(A) For casirivimab, the correlation coefficient between the two methods is r2=0.9568, p<0.0001 and slope=1.014. (B) For imdevimab, the correlation coefficient between the two methods is r2=0.9562, p<0.0001, and slope=1.117. The 95% prediction intervals are shown with dotted lines.
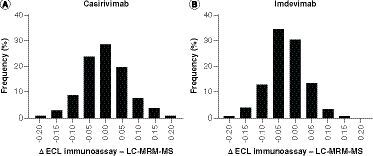
The D'Agostino and Pearson test for normal distribution (A) for casirivimab (p=0.2394) and (B) for imdevimab (p=0.2099).
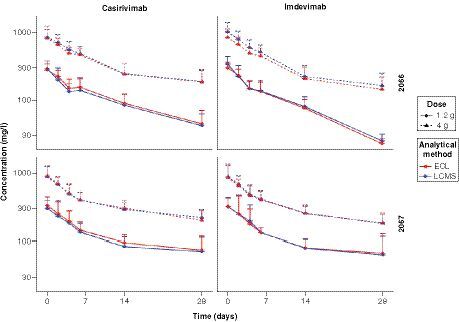
(A & B) The x-axis in each plot is the mean of the two measures and the y-axis is the difference between methods (ECL immunoassay result minus LC-MRM-MS assay result). (A) For casirivimab (n=424), the bias from immunoassay to LC-MRM-MS (±SD) is -4.2 (±61.3; 95% limits of agreement -124.3 to 115.9). (B) For imdevimab (n=444), the bias from immunoassay to LC-MRM-MS (±SD) is -23.6 (±68.7; 95% limits of agreement -158.2 to 111.0). (C & D) The x-axis in each plot is the average of the two measures and the y-axis is the percentage of the values on the axis ([ECL immunoassay result minus LC-MRM-MS assay result], divided by mean and expressed as a percentage). (C) For casirivimab, the bias from immunoassay to LC-MRM-MS (±SD) is -0.5% (±16.2; 95% limits of agreement -32.2 to 31.2). (D) For imdevimab, the bias from immunoassay to LC-MRM-MS (±SD) is -6.0% (±13.17; 95% limits of agreement -31.8 to 19.9).
![Figure 3. Bland-Altman analyses for the ECL immunoassay and the LC-MRM-MS assay. (A & B) The x-axis in each plot is the mean of the two measures and the y-axis is the difference between methods (ECL immunoassay result minus LC-MRM-MS assay result). (A) For casirivimab (n=424), the bias from immunoassay to LC-MRM-MS (±SD) is -4.2 (±61.3; 95% limits of agreement -124.3 to 115.9). (B) For imdevimab (n=444), the bias from immunoassay to LC-MRM-MS (±SD) is -23.6 (±68.7; 95% limits of agreement -158.2 to 111.0). (C & D) The x-axis in each plot is the average of the two measures and the y-axis is the percentage of the values on the axis ([ECL immunoassay result minus LC-MRM-MS assay result], divided by mean and expressed as a percentage). (C) For casirivimab, the bias from immunoassay to LC-MRM-MS (±SD) is -0.5% (±16.2; 95% limits of agreement -32.2 to 31.2). (D) For imdevimab, the bias from immunoassay to LC-MRM-MS (±SD) is -6.0% (±13.17; 95% limits of agreement -31.8 to 19.9).](/cms/asset/94f98ea5-05e3-492d-9862-197cd2a4d001/ibio_a_12352681_f0003.jpg)
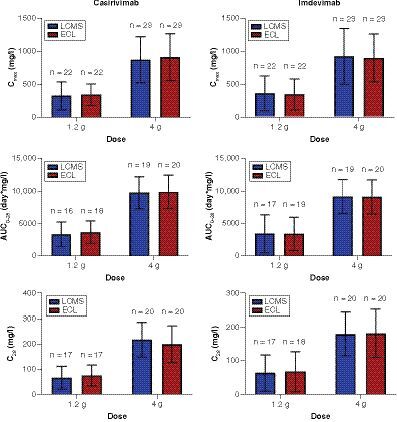
Error bars indicate standard deviation.
For the 1.2 gand 4g doses per mAb, the following parameters are presented as mean±standard deviation (SD) with number of subjects identified for each calculation (n): (top) maximum drug concentration in blood (Cmax), (middle) area under concentration by time curve up to 28days post-dose (AUC0–28), and (bottom) drug concentration in serum at 28days after dose (C28).