Figures & data
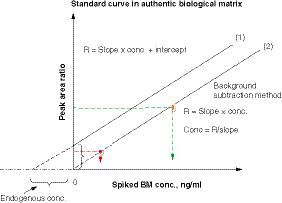
Using a series of analyte standards spiked to an authentic matrix containing the endogenous analyte, a standard curve equation can be expressed as R = slope × conc. + intercept, where R is the ratio of analyte BM peak area to its internal standard peak area and conc. is concentration. When the endogenous analyte level in the matrix is greater than zero, there is a positive intercept in the standard curve (1). When the endogenous analyte concentration is subtracted from each spiked standard, the intercept is near zero in the standard curve (2). The standard curve (2) can be used for concentration calculation for all unknown samples in the same analytical run.
BM: Biomarker; conc.: Concentration.
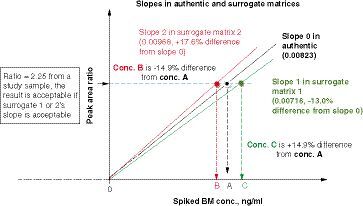
A peak area ratio of 2.25 (analyte to internal standard) from an authentic sample can be calculated with one of the three standard curve slopes. If the interpreted concentration is within ± 15% bias of the true concentration (using authentic matrix slope), that is, % slope difference from the authentic matrix slope (0.00823) ranges from -13.0 to +17.6%, then the standard curve in the surrogate matrix is considered to be parallel to the standard curve in the authentic matrix.
BM: Biomarker; conc.: Concentration.
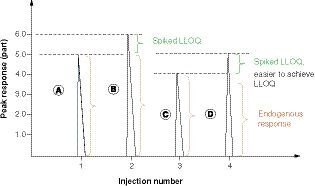
(A) A high endogenous analyte concentration in the matrix of the standard curve will prevent achieving assay sensitivity (LLOQ). The peak response of matrix A contains the endogenous analyte concentration, 5 parts on the vertical axis. (B) The peak response of spiked LLOQ (only 20% of an endogenous level) onto matrix A. When the ratio of endogenous response (A = 5.0 parts) to net LLOQ response (B-A = LLOQ, 1.0 part) = or >5.0, the desired LLOQ is hard to achieve, as the variability of LLOQ (20%) is the same as the % increase of endogenous concentration in peak B. (C) Matrix C response containing a lower level of endogenous analyte concentration than Matrix A. (D) Spiked LLOQ on matrix C. The endogenous analyte is about 20% lower in matrix C than in matrix A. It will be easy to see enough response difference between peak D and peak C, which is C/(D - C) ≤4.0. Multiple biomarker assay experiments verified that the ratio of endogenous analyte peak response in the matrix to the net LLOQ response must be <4.0, then the desired LLOQ can be achieved or achievable with its precision and accuracy criteria of 20% bias. It can be concluded that assay LLOQ is dependent on the endogenous level of the matrix blank for its standard curve. The higher the endogenous level, the more difficult it is to achieve the desired LLOQ.
LLOQ: Lower limit of quantitation.