Figures & data
All city figures are based on the primary local authority (or city council) for each city. National Indicator NI186 (with exclusions) is used for each city.
*Core City (England).
Data taken fromCitation[87].
![Figure 1. Per capita CO2 emissions for the top 20 UK Cities by population size, 2009.All city figures are based on the primary local authority (or city council) for each city. National Indicator NI186 (with exclusions) is used for each city.*Core City (England).Data taken fromCitation[87].](/cms/asset/5929459f-43f5-4339-af16-dc149ed0ba3a/tcmt_a_10816407_f0001.gif)
Data taken fromCitation[87].
![Figure 2. Trends in carbon emissions, between the years 2005–2010, in Core Cities and the UK.Data taken fromCitation[87].](/cms/asset/af94e451-080e-4662-8627-a3cc075004a1/tcmt_a_10816407_f0002.gif)
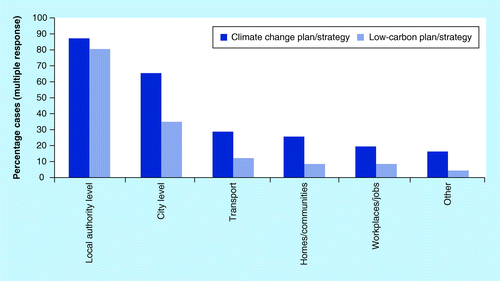
Extent to which sectoral targets are included in each type of plan.
Sectoral targets by city type.
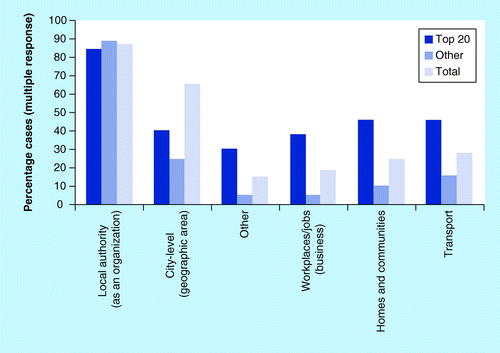
Table 1. Examples of low-carbon partnerships in UK cities, based on survey responses and document analysis.
Supplemental material