Figures & data
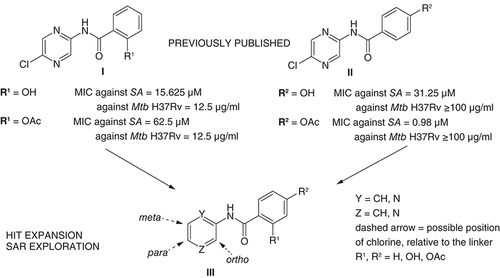
MIC: Minimum inhibitory concentration; Mtb: Mycobacterium tuberculosis; SA: Staphylococcus aureus; SAR: Structure–activity relationship.
(A) Acylation, (B) hydrolysis and (C) acetylation. Analogically used for 4-substituted and 2,4-disubstituted derivatives.
DCM: Dichloromethan; DMF: N,N-dimethylformamide.
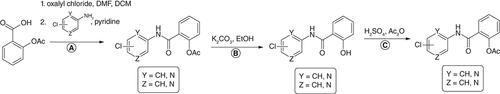
Table 1. Antibacterial activity expressed as MIC in μM.Table Footnote†
The heat map represents the cumulative activity (reciprocal to MIC), from blue (lowest) to red (highest). See the online version of the manuscript for a colored version of the figure.
MIC: Minimum inhibitory concentration.
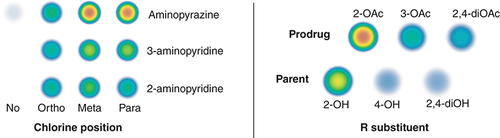
Table 2. Antimycobacterial activity expressed as minimum inhibitory concentration in μg/ml.
Inhibition of biosynthetic pathway is indicated by lower incorporation of radioactively labelled precursors (A) [3H] N-acetylglucosamine, (B) [3H] uridine, (C) [3H] thymidine and (D) [3H] Leu by methicillin-resistant Staphylococcus aureus (ATCC 43300) strain treated for 2 h at 4 × MIC of VAN, RIF, CIP, CHF, CHX, compound 1 or 5Ac and UCRL. Results are expressed as the percentage of untreated controls. The values shown are means of two independent experiments prepared in duplicates ± SEM. Dotted lines represent 100% incorporation of labelled macromolecules (UCRL). Significant reduction in biosynthetic pathway compared with UCRL is indicated by p-value where p < 0.05 was accepted as statistically significant determined by nonparametric one-way ANOVA test (Kruskal–Wallis test).
*p < 0.05; **p < 0.01; ***p < 0.001; ****p < 0.0001.
ANOVA: Analysis of variance; ATCC: American Type Collection Cultures; CHF: Chloramphenicol; CHX: Chlorhexidine; CIP: Ciprofloxacin; RIF: Rifampicin; SEM: Standard error of the mean; UCRL: Untreated control; VAN: Vancomycin.
![Figure 4. Results of macromolecular assay.Inhibition of biosynthetic pathway is indicated by lower incorporation of radioactively labelled precursors (A) [3H] N-acetylglucosamine, (B) [3H] uridine, (C) [3H] thymidine and (D) [3H] Leu by methicillin-resistant Staphylococcus aureus (ATCC 43300) strain treated for 2 h at 4 × MIC of VAN, RIF, CIP, CHF, CHX, compound 1 or 5Ac and UCRL. Results are expressed as the percentage of untreated controls. The values shown are means of two independent experiments prepared in duplicates ± SEM. Dotted lines represent 100% incorporation of labelled macromolecules (UCRL). Significant reduction in biosynthetic pathway compared with UCRL is indicated by p-value where p < 0.05 was accepted as statistically significant determined by nonparametric one-way ANOVA test (Kruskal–Wallis test).*p < 0.05; **p < 0.01; ***p < 0.001; ****p < 0.0001.ANOVA: Analysis of variance; ATCC: American Type Collection Cultures; CHF: Chloramphenicol; CHX: Chlorhexidine; CIP: Ciprofloxacin; RIF: Rifampicin; SEM: Standard error of the mean; UCRL: Untreated control; VAN: Vancomycin.](/cms/asset/77790746-ada7-4f5c-baaa-a4656fc3df03/ifmc_a_12362252_f0004.jpg)
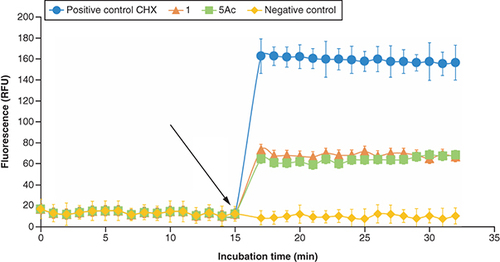
Measured by DiSC3(5)-based kinetic fluorescence. The graph depicts the mean and SD of six replicates. The black arrow indicates the time of addition of tested compounds or positive control.
CHX: Chlorhexidine; SD: Standard deviation; RFU: Relative fluorescence units.