
Figures & data
Figure 1. Transmission electron micrographs of liposomal dispersions.
(A) Conventional and (B) PEGylated liposomes loaded with opiorphin.
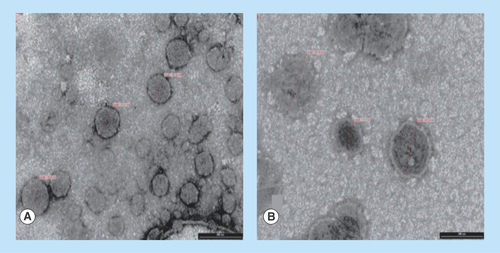
Figure 2. Mean diameter of vesicles.
Conventional and PEGylated liposomes loaded with opiorphin. Liposomes were stored at 4°C in sealed containers, protected from light.
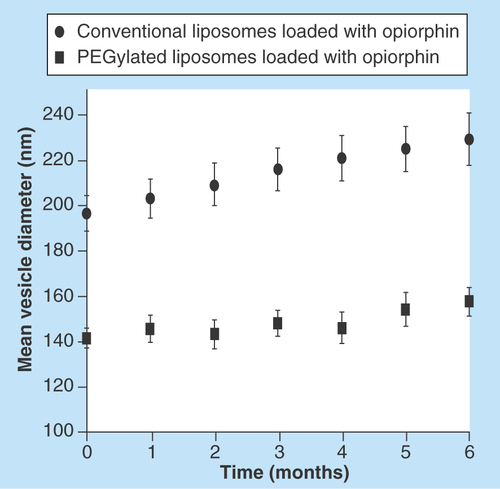
Figure 3. Normalized mean (±SEM.) degree of antinociception (expressed as percentage of the maximum possible effect) versus time curve achieved by the rat tail-flick latency test.
The presented data were obtained after single-dose intravenous administration of: phosphate-buffered saline (blank control); 5 mg/kg of opiorphin, free or loaded in conventional liposomes or in PEGylated liposomes; 5 mg/kg of morphine.
*p < 0.05 vs phosphate-buffered saline treated rats at a given time point.
§p < 0.05 vs morphine treatments and/or vs conventional liposomes (n = 6).
MPE: Maximum possible effect.
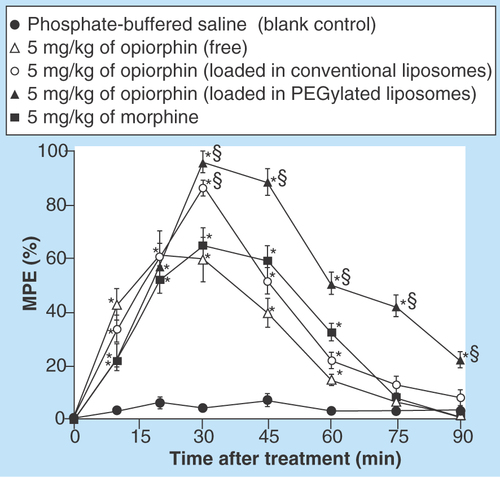
Figure 4. AUC values after single-dose intravenous administration to rats of 5 mg/kg of different opiorphin formulations or morphine (positive control).
AUC values obtained according to the tail-flick latency test of antinociception (units for AUC values: maximum possible effect[%]/h). Values are mean ±SEM (n = 6).
*p < 0.05 vs opi.
§p < 0.05 vs morphine, opi and CL-opi.
CL-opi: Opiorphin loaded in conventional liposomes; Opi: Free opiorphin; PL-opi: Oopiorphin loaded in PEGylated liposomes.
![Figure 4. AUC values after single-dose intravenous administration to rats of 5 mg/kg of different opiorphin formulations or morphine (positive control).AUC values obtained according to the tail-flick latency test of antinociception (units for AUC values: maximum possible effect[%]/h). Values are mean ±SEM (n = 6).*p < 0.05 vs opi.§p < 0.05 vs morphine, opi and CL-opi.CL-opi: Opiorphin loaded in conventional liposomes; Opi: Free opiorphin; PL-opi: Oopiorphin loaded in PEGylated liposomes.](/cms/asset/93f45bc4-a23d-49a2-aebe-d21ef5099256/ifso_a_12363837_f0006.jpg)