
Figures & data
Figure 1. Synthesis and protein binding of O-GNR-PEG-DSPE.
(A) Depiction of an O-GNR and O-GNR-PEG-DSPE (structures not to scale). (B) Representative TEM image of O-GNR and O-GNR-PEG-DSPE. (C) Concentration of human serum albumin in the supernatant of O-GNR and O-GNR-PEG-DSPE (at 10 and 80 µg/ml) treated protein solution centrifuged for 30 min at 3000 rpm. Concentration of the untreated but centrifuged control protein solution is provided as a reference. Data are presented as mean +SD (n = 4 per group).
* = p < 0.05 between untreated control and particular treatment group.
DSPE: 1,2-distearoyl-sn-glycero-3-phosphoethanolamine; O-GNR: Oxidized graphene nanoribbon; PEG: Poly-thylene glycol.
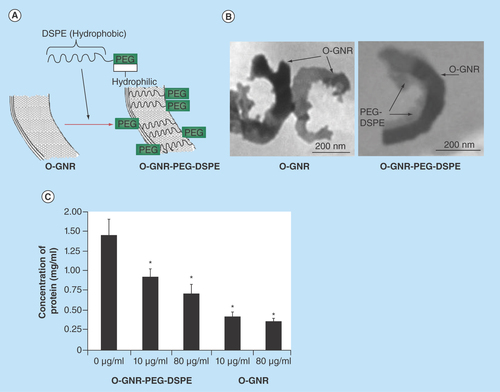
Figure 2. Analysis of hemolytic potential of O-GNR-PEG-DSPE.
(A) Representative image of untreated control red blood cells. (B) Representative image showing hemolyzed cells treated with poly ethylene imine. (C–E) Representative images of blood cells treated with 20, 80 and 160 µg/ml GNR-PEG-DSPE for 3 h, respectively. In (A–E) black arrow represents a normal shaped RBC, red arrow represents abnormal shaped RBC and blue arrow represents lysed RBC. (F) Representative TEM image of a hemolyzed red blood cell treated with O-GNR-PEG-DSPE. Red arrow indicates lysed region and black arrow indicates the nanoparticles. (G) Absorbance at 540 nm obtained after conversion of the hemoglobin present in supernatant of red blood cells treated with the nanoribbons to cyanomethemoglobin. The supernatants were obtained by centrifuging red blood cell suspensions treated with GNR-PEG-DSPE formulations, PEG-DSPE or Triton X 100 for 3 h. Data are presented as mean +SD (n = 4 per group).
* = p < 0.05 between untreated control and particular treatment group.
O-GNR: Oxidized graphene nanoribbon; PEG-DSPE: 1, 2-distearoyl-sn-glycero-3-phosphoethanolamine-N (amino [polyethylene glycol]); RBC: Red blood cell.
![Figure 2. Analysis of hemolytic potential of O-GNR-PEG-DSPE.(A) Representative image of untreated control red blood cells. (B) Representative image showing hemolyzed cells treated with poly ethylene imine. (C–E) Representative images of blood cells treated with 20, 80 and 160 µg/ml GNR-PEG-DSPE for 3 h, respectively. In (A–E) black arrow represents a normal shaped RBC, red arrow represents abnormal shaped RBC and blue arrow represents lysed RBC. (F) Representative TEM image of a hemolyzed red blood cell treated with O-GNR-PEG-DSPE. Red arrow indicates lysed region and black arrow indicates the nanoparticles. (G) Absorbance at 540 nm obtained after conversion of the hemoglobin present in supernatant of red blood cells treated with the nanoribbons to cyanomethemoglobin. The supernatants were obtained by centrifuging red blood cell suspensions treated with GNR-PEG-DSPE formulations, PEG-DSPE or Triton X 100 for 3 h. Data are presented as mean +SD (n = 4 per group).* = p < 0.05 between untreated control and particular treatment group.O-GNR: Oxidized graphene nanoribbon; PEG-DSPE: 1, 2-distearoyl-sn-glycero-3-phosphoethanolamine-N (amino [polyethylene glycol]); RBC: Red blood cell.](/cms/asset/dbaf435a-8669-4411-bc24-e44352fcdad8/ifso_a_12363822_f0002.jpg)
Figure 3. Representative TEM images of red blood cells treated with 80 µg/ml O-GNR-PEG-DSPE for 3 h or left untreated.
(A) Representative TEM image of cross section of red blood cell not treated with O-GNR-PEG-DSPE. (B) Representative TEM image of cross section of a red blood cell treated with PEG-DSPE showing loss of concave shape on one side (black arrow). (C) Representative TEM image of cross section of a red blood cell treated with PEG-DSPE showing loss of concave shape on both sides. (D) Representative TEM image of cross section of a red blood cell treated with O-GNR-PEG-DSPE showing formation of a spherical cross section due to loss of structural integrity of the cells. O-GNR-PEG-DSPE particles are indicated with red arrows whereas protrusions/fragmentation from the membrane are indicated with black arrows.
O-GNR-PEG-DSPE: Graphene nanoribbon, 1, 2-distearoyl-sn-glycero-3-phosphoethanolamine-N (amino [polyethylene glycol]).
![Figure 3. Representative TEM images of red blood cells treated with 80 µg/ml O-GNR-PEG-DSPE for 3 h or left untreated.(A) Representative TEM image of cross section of red blood cell not treated with O-GNR-PEG-DSPE. (B) Representative TEM image of cross section of a red blood cell treated with PEG-DSPE showing loss of concave shape on one side (black arrow). (C) Representative TEM image of cross section of a red blood cell treated with PEG-DSPE showing loss of concave shape on both sides. (D) Representative TEM image of cross section of a red blood cell treated with O-GNR-PEG-DSPE showing formation of a spherical cross section due to loss of structural integrity of the cells. O-GNR-PEG-DSPE particles are indicated with red arrows whereas protrusions/fragmentation from the membrane are indicated with black arrows.O-GNR-PEG-DSPE: Graphene nanoribbon, 1, 2-distearoyl-sn-glycero-3-phosphoethanolamine-N (amino [polyethylene glycol]).](/cms/asset/6aedf6f8-ced9-4e27-a062-d56b357a371d/ifso_a_12363822_f0003.jpg)
Figure 4. Representative TEM images of red blood cells showing interaction of RBC membrane with 80 µg/ml O-GNR-PEG-DSPE.
(A) Representative TEM image of a red blood cell showing edges of O-GNR-PEG-DSPE in contact with RBC membrane. (B&C) Representative TEM images of red blood cells showing membrane disintegration/ruffling (red arrows) at the site of surface contact. (D) Representative TEM images of red blood cells showing membrane depression (red arrows) at the site physical contact with the nanoparticles. (E&F) Representative TEM images of red blood cells showing membrane protrusions/fragmentations near the sites where cell membrane comes in contact with O-GNR-PEG-DSPE. O-GNR-PEG-DSPE particles are indicated with blue arrows whereas protrusions/fragmentation from the membrane are indicated with red arrows. The site of contact of RBC membrane with O-GNR-PEG-DSPE particles is indicated with black arrows.
O-GNR-PEG-DSPE: Graphene nanoribbon, 1, 2-distearoyl-sn-glycero-3-phosphoethanolamine-N (amino [polyethylene glycol]).
![Figure 4. Representative TEM images of red blood cells showing interaction of RBC membrane with 80 µg/ml O-GNR-PEG-DSPE.(A) Representative TEM image of a red blood cell showing edges of O-GNR-PEG-DSPE in contact with RBC membrane. (B&C) Representative TEM images of red blood cells showing membrane disintegration/ruffling (red arrows) at the site of surface contact. (D) Representative TEM images of red blood cells showing membrane depression (red arrows) at the site physical contact with the nanoparticles. (E&F) Representative TEM images of red blood cells showing membrane protrusions/fragmentations near the sites where cell membrane comes in contact with O-GNR-PEG-DSPE. O-GNR-PEG-DSPE particles are indicated with blue arrows whereas protrusions/fragmentation from the membrane are indicated with red arrows. The site of contact of RBC membrane with O-GNR-PEG-DSPE particles is indicated with black arrows.O-GNR-PEG-DSPE: Graphene nanoribbon, 1, 2-distearoyl-sn-glycero-3-phosphoethanolamine-N (amino [polyethylene glycol]).](/cms/asset/3c89d327-2a69-4bda-89f9-3d13633048c1/ifso_a_12363822_f0004.jpg)
Figure 5. Analysis of histamine release, complement activation, platelet activation and cytokine release.
(A) Histamine release from activated and induced RBL-2H3cells treated O-GNR-PEG-DSPE (0–80 µg/ml) formulations for 1 h. (B) Platelet activation assay presented in terms of PF4 production in whole human blood from two individuals incubated at 0–80 µg/ml O-GNR-PEG-DSPE concentrations for 1 h. (C) Total complement activation assay presented in terms of Sc5b-9 protein production in human whole blood from two individuals treated with various O-GNR-PEG-DSPE (0–80 µg/ml) concentrations for 1 h. (D) Alternate complement pathway activation in terms of Bb protein production in two human whole blood samples treated with various concentrations of O-GNR-PEG-DSPE (0–80 µg/ml) for 1 h. (E) Proinflammatory cytokine release assay presented in terms of TNF-α release in whole human whole blood from two individuals treated with various O-GNR-PEG-DSPE (0–80 µg/ml) concentrations for 1 h. (F) Anti-inflammatory cytokine release assay presented in terms of IL-10 release in whole human blood from two individuals treated with various O-GNR-PEG-DSPE(0–80 µg/ml) concentrations for 1 h. Data are presented as mean + SD (n = 4 per group). * = p < 0.05 between untreated control and particular treatment group.
O-GNR-PEG-DSPE: Graphene nanoribbon, 1, 2-distearoyl-sn-glycero-3-phosphoethanolamine-N (amino [polyethylene glycol]).
![Figure 5. Analysis of histamine release, complement activation, platelet activation and cytokine release.(A) Histamine release from activated and induced RBL-2H3cells treated O-GNR-PEG-DSPE (0–80 µg/ml) formulations for 1 h. (B) Platelet activation assay presented in terms of PF4 production in whole human blood from two individuals incubated at 0–80 µg/ml O-GNR-PEG-DSPE concentrations for 1 h. (C) Total complement activation assay presented in terms of Sc5b-9 protein production in human whole blood from two individuals treated with various O-GNR-PEG-DSPE (0–80 µg/ml) concentrations for 1 h. (D) Alternate complement pathway activation in terms of Bb protein production in two human whole blood samples treated with various concentrations of O-GNR-PEG-DSPE (0–80 µg/ml) for 1 h. (E) Proinflammatory cytokine release assay presented in terms of TNF-α release in whole human whole blood from two individuals treated with various O-GNR-PEG-DSPE (0–80 µg/ml) concentrations for 1 h. (F) Anti-inflammatory cytokine release assay presented in terms of IL-10 release in whole human blood from two individuals treated with various O-GNR-PEG-DSPE(0–80 µg/ml) concentrations for 1 h. Data are presented as mean + SD (n = 4 per group). * = p < 0.05 between untreated control and particular treatment group.O-GNR-PEG-DSPE: Graphene nanoribbon, 1, 2-distearoyl-sn-glycero-3-phosphoethanolamine-N (amino [polyethylene glycol]).](/cms/asset/74c2f38e-511b-47c0-a3f4-3e7f129bed39/ifso_a_12363822_f0005.jpg)
Figure 6. Effect of O-GNR-PEG-DSPE on endothelial cells.
O-GNR-PEG-DSPE: Graphene nanoribbon, 1, 2-distearoyl-sn-glycero-3-phosphoethanolamine-N (amino [polyethylene glycol]).
![Figure 6. Effect of O-GNR-PEG-DSPE on endothelial cells.O-GNR-PEG-DSPE: Graphene nanoribbon, 1, 2-distearoyl-sn-glycero-3-phosphoethanolamine-N (amino [polyethylene glycol]).](/cms/asset/2fcfd80a-cf96-43ea-86f6-efd8ab3a8541/ifso_a_12363822_f0006.jpg)