
Figures & data
Figure 1. Artery parabolic blood flow velocity profile.
Velocity is maximal in the central part of the vessel and gradually diminishes as blood approaches the vessel wall.
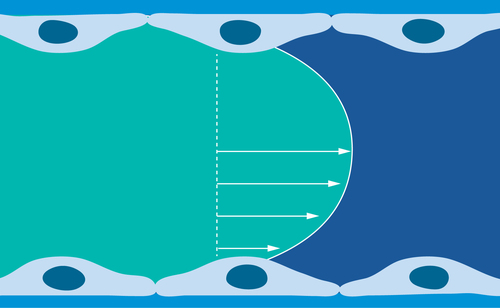
Figure 4. Distribution of platelets and erythrocytes in arterial flowing laminar blood.
The rotating and deforming erythrocytes increase the concentration of platelets at the vessel wall.
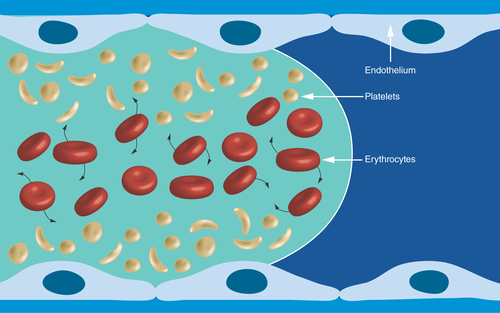
Figure 5. Human ex vivo parallel-plate blood perfusion device.
Blood is drawn from an antecubital vein by the pump. Ex vivo studies of therapeutic agents not requiring in vivo metabolism can be injected upstream to the perfusion chamber with the reactive surface. Blood sampling for biomarker analysis can be collected downstream to the perfusion chamber.
Reproduced with permission from [Citation19] © Future Medicine (2007).
![Figure 5. Human ex vivo parallel-plate blood perfusion device.Blood is drawn from an antecubital vein by the pump. Ex vivo studies of therapeutic agents not requiring in vivo metabolism can be injected upstream to the perfusion chamber with the reactive surface. Blood sampling for biomarker analysis can be collected downstream to the perfusion chamber.Reproduced with permission from [Citation19] © Future Medicine (2007).](/cms/asset/4065266d-022b-41e8-ba66-0bc546bd5b26/ifso_a_12363848_f0005.jpg)
Figure 6. Typical blood flow velocity profile in the parallel-plate blood perfusion chamber.
The shear rate and shear stress profiles would basically be related to the slope of the velocity profile – zero at center and maximal at the wall where the velocity is zero. Formulas for calculation of wall shear rate (Y) and shear stress (u) are indicated above the figure.
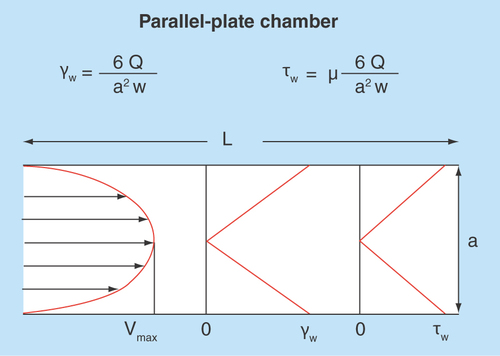
Table 1. Selected ex vivo perfusion chamber models of human thrombosis.