
Figures & data
Figure 1. Representation of the experimental sampling set up.
Two of the membranes were used for MS measurements for each time point.
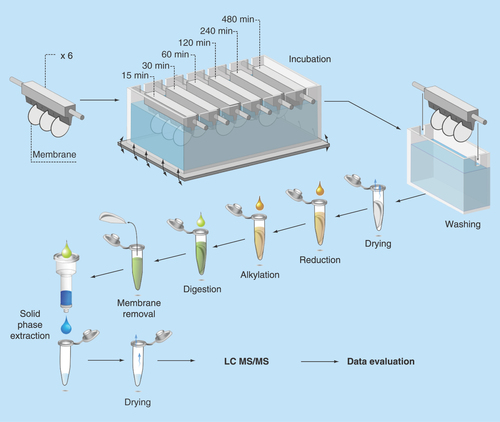
Figure 2. Number of adsorbed proteins as function of time.
The total number of adsorbed proteins at each time point, detected with at least two unique peptides, plotted against time of adsorption. Two experimental replicates were used at every time point.
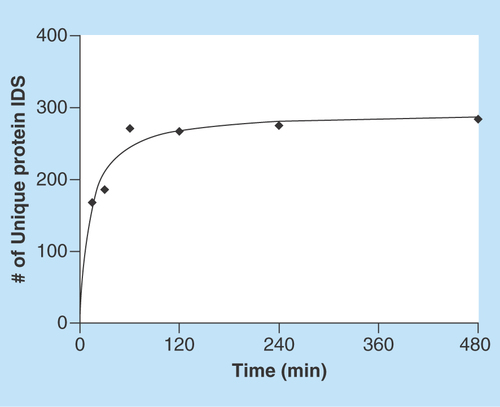
Figure 3. Protein adsorption behavior grouping.
Counted and grouped proteins according to adsorption time for detection (black square). The adsorption time is presented on the x-axis and group name and number of proteins detected per group are presented on the y-axis. Group A are proteins that are adsorbed at every time point. Group B has an initial first adsorption delay and thereafter detected at following time points. Group B is further divided into sub groups depending on when first adsorption is detected. Group C are proteins that are adsorbed from the first time point to a later point. Group D are proteins that show no clear adsorption pattern indicated by nonuniform gray squares illustrating randomness. Proteins were identified with at least two unique peptides at one time point in the time interval.
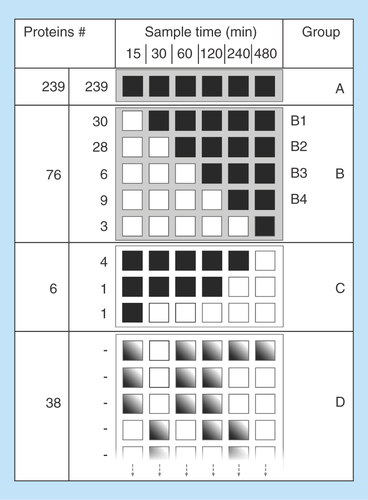
Figure 4 Evaluation of protein adsorption behaviour.
(A) Protein sequence coverage change. The slope of protein sequence change depending on time for serum albumin (solid line) and cystatin-C (dashed line) is the linear regression of all sample points (15–480 min). Proteins identified with two unique peptides at least at one time point in interval. (B) Mean slope parameter values. The mean slope value for protein score (red circle), peptide spectrum match (white square) and protein sequence coverage (blue diamond), for different adsorbing behavior groups, which from left to right are: A (15–480), B1 (30–480), B2 (60–480), B3 (120–480), B4 (240–480) min. Proteins identified with two unique peptides at least at one time point in the time interval.
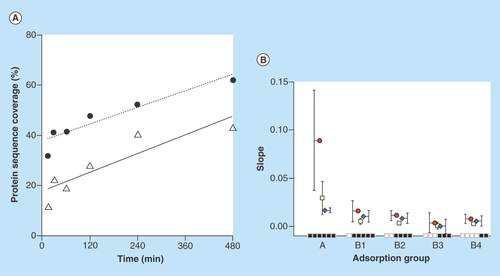
Figure 5. Protein weight and isoelectric point comparison with adsorption behavior.
Median (straight bar in box), mean (black spot) and 90% interval of the molecular weight (y-axis in [A]) and isoelectric point (y-axis in [B]) for the different proteins adsorbed at different incubation times and detected on all the later time points (x-axis). From left to right: A (15–480), B1 (30–480), B2 (60–480), B3 (120–480), B4 (240–480) min. Proteins identified with two unique peptides at least at one time point in the time interval.
![Figure 5. Protein weight and isoelectric point comparison with adsorption behavior.Median (straight bar in box), mean (black spot) and 90% interval of the molecular weight (y-axis in [A]) and isoelectric point (y-axis in [B]) for the different proteins adsorbed at different incubation times and detected on all the later time points (x-axis). From left to right: A (15–480), B1 (30–480), B2 (60–480), B3 (120–480), B4 (240–480) min. Proteins identified with two unique peptides at least at one time point in the time interval.](/cms/asset/39db1b7e-5829-4d43-a86a-44195c1e7ebc/ifso_a_12363847_f0005.jpg)