Figures & data
Figure 1. Model systems.
Shown clockwise from left, common laboratory mouse (Mus musculus), fruit fly (Drosophila melanogaster), zebrafish (Danio rerio), roundworm/nematode (Caenorhabditis elegans), baker's yeast (Saccharomyces cerevisiae) and bacteria (Escherischia coli).
Images obtained through Creative Commons license, with specific credit to the following: mouse, G. Shuklin; fly, Bbski; worm, kbradnam; bacteria, Rocky Mountain Laboratories.
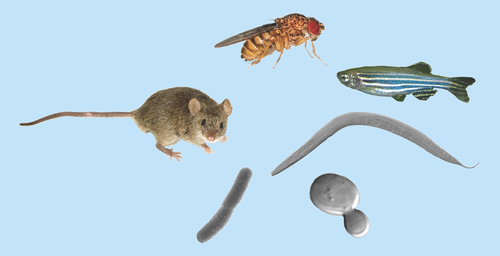
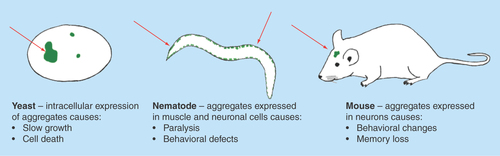
Figure 2. Organism-specific phenotypes resulting from protein aggregation.
Salient phenotypes arising from protein aggregation are described. In most cases severity scales with the amount or frequency of aggregation, allowing quantifiable assessment of physiological impact.