
Figures & data
Figure 1. PERK in the unfolded protein response.
As unfolded proteins appear in the ER lumen, the chaperone GRP78 releases PERK, allowing the latter to dimerize in the ER membrane, resulting in autophosphorylation. This activates PERK's kinase domain, phosphorylating eIF2α and halting translation in the cytosol. ATF4 mRNA is preferentially translated, and that transcription factor drives gene expression of amino acid transporters, anti-oxidant genes, XBP-1, CHOP/GADD153 and GADD34. CHOP may lead to apoptotic induction, while GADD34 is a subunit of the type 1 protein ser/thr phosphatase PPI, which dephosphorylates eIF2α to resume translation.
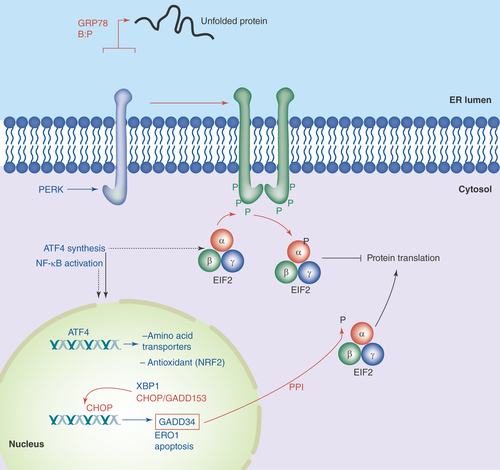
Figure 2. IRE1 in the unfolded protein response.
Accumulation of unfolded proteins in the ER lumen is sensed by the IRE1 lumenal domain (with possible release from GRP78), leading to dimerization or oligomerization. This results in autophosphorylation and kinase activation in IRE1's cytosolic domains, which induces IRE1 ribonuclease activity, allowing for the splicing of XBP-1 mRNA. The new stable transcription factor drives gene transcription for increased chaperone output, lipid biosynthetic enzymes, components of the ERAD degradation system and more XBP-1.
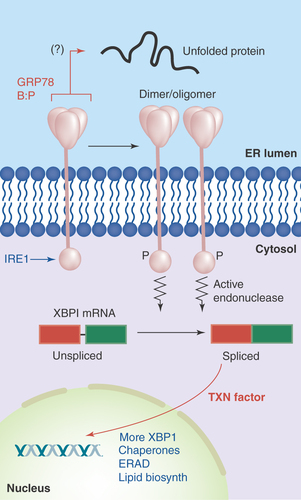
Figure 3. ATF6 in the unfolded protein response.
Accumulation of unfolded proteins in the ER lumen leads to the release of GRP78 from the lumenal domain of ATF6, which can now traverse into the Golgi. There, Golgi resident proteases S1P and S2P cleave ATF6's intramembrane region, releasing the active transcription factor into the cytosol and nucleus. Among the genes activated by ATF6 are those encoding chaperones and yet more XBP-1.
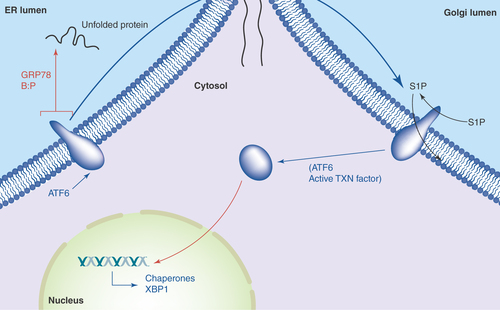
Figure 4. Brain tumors overexpress chaperone proteins and may localize them to the cell surface.
(A) Western blots of lysates from xenografts of various adult and pediatric gliomas and a medulloblastoma were probed for HSP90, GRPs 94 and 78, and calreticulin. Normal rat brain is used as a comparator tissue, and probes for actin are shown as loading controls. (B) FACS analyses of GBM (D54MG) and medulloblastoma (D341MED) cell lines with surface staining for heat shock and chaperone proteins shown (HspBP1 is an HSP70 family co-chaperone; ABC is α-B crystallin). Background from murine or rat isotype control antibodies is shown in dark fill.
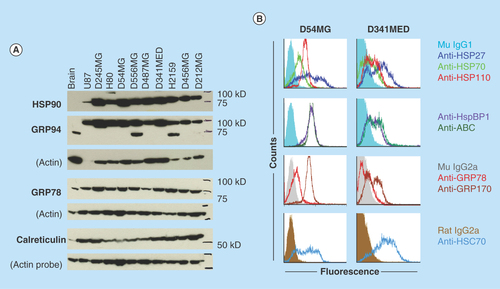
Figure 5. Glioblastoma ‘stem cell’ lines following UPR induction resist treatment with an HSP90 inhibitor.
Primary cell lines ([A] GBM-1, from a recurrent tumor, and [B] GBM-6, from a primary tumor) were generated in stem cell medium and were cultured as ‘neurospheres’. Cells were treated (or not) with dithiothreitol to induce the unfolded protein response. Groups of cells were then treated (or not) with very high doses of the HSP90 inhibitor PU-H71 (100 mM) for 48 h. Cell proliferation was measured by MTS assay and is set to 100% for untreated controls (red bars). Statistical differences in proliferation were determined by t-test compared to untreated controls.
**p < 0.01; ***p < 0.005.
![Figure 5. Glioblastoma ‘stem cell’ lines following UPR induction resist treatment with an HSP90 inhibitor.Primary cell lines ([A] GBM-1, from a recurrent tumor, and [B] GBM-6, from a primary tumor) were generated in stem cell medium and were cultured as ‘neurospheres’. Cells were treated (or not) with dithiothreitol to induce the unfolded protein response. Groups of cells were then treated (or not) with very high doses of the HSP90 inhibitor PU-H71 (100 mM) for 48 h. Cell proliferation was measured by MTS assay and is set to 100% for untreated controls (red bars). Statistical differences in proliferation were determined by t-test compared to untreated controls.**p < 0.01; ***p < 0.005.](/cms/asset/cd5fb7e2-bfee-41bd-a395-56c783fa7e12/ifso_a_12363811_f0005.jpg)
Figure 6. The proapoptotic transcription factor CHOP/GADD153 may be sequestered in the cytosol in some brain tumors.
CHOP may be induced by the PERK arm of the UPR (). Shown is an immunohistochemical stain for CHOP on 5 μm paraffin sections of a D245MG GBM xenograft tumor (IHC details are in Epple et al. [Citation12]). Counterstain is hematoxylin/eosin (resulting in blue nuclear staining, while brown staining is for the CHOP protein). Nearly all of the nuclei are spared of the immunostain, suggesting that CHOP cannot enter the nuclei.
![Figure 6. The proapoptotic transcription factor CHOP/GADD153 may be sequestered in the cytosol in some brain tumors.CHOP may be induced by the PERK arm of the UPR (Figure 1). Shown is an immunohistochemical stain for CHOP on 5 μm paraffin sections of a D245MG GBM xenograft tumor (IHC details are in Epple et al. [Citation12]). Counterstain is hematoxylin/eosin (resulting in blue nuclear staining, while brown staining is for the CHOP protein). Nearly all of the nuclei are spared of the immunostain, suggesting that CHOP cannot enter the nuclei.](/cms/asset/6c9a15d5-843d-4f9a-a60a-fa40e97534bb/ifso_a_12363811_f0006.jpg)