Figures & data
Figure 1. The values (mean ± standard deviation) of proliferation assay of lypopolysaccharide/phytohemagglutinin/un-stimulated spelnocytes treated with various concentrations of Berberis integerrima alcoholic extract.
1–1000 μg/ml of extracts reduced PHA stimulated splenocytes (as T cells) proliferation and enhanced proliferation of LPS stimulated (as B cells) or unstimulated splenocytes. Significant differences are designated as *p < 0.05.
LPS: Lypopolysaccharide; PHA: Phytohemagglutinin.
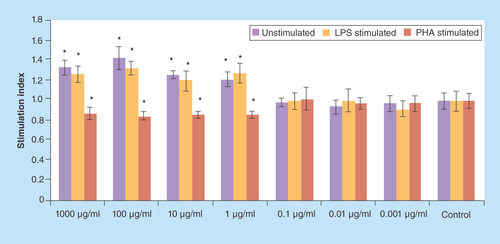
Figure 2. The values (mean ± standard deviation) of proliferation assay of lypopolysaccharide/phytohemagglutinin/un-stimulated spelnocytes treated with various concentrations of Berberis integerrima aqueous extract.
0.01–1000 μg/ml of extracts reduced PHA stimulated splenocytes (as T cells) proliferation. Significant differences are designated as *p < 0.05.
LPS: Lypopolysaccharide; PHA: Phytohemagglutinin.
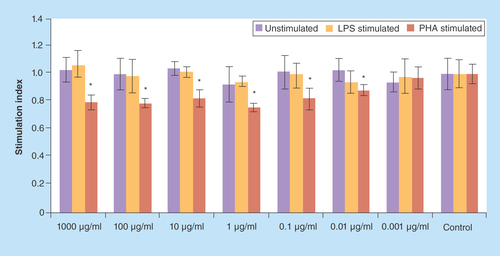
Figure 3. IFN-γ production in splenocytes treated with various concentrations of Berberis integerrima (A) alcoholic and (B) aqueous extracts.
Significant differences were designated as *p < 0.05.
SD: Standard deviation.
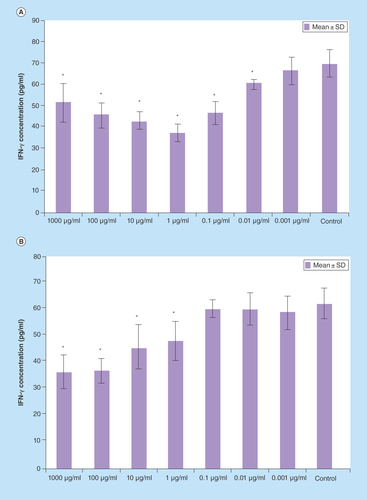
Figure 4. IL-4 production splenocytes treated with various concentrations of Berberis integerrima (A) alcoholic and (B) aqueous extracts.
Significant differences were designated as *p < 0.05.
SD: Standard deviation.

Figure 5. IL-10 production splenocytes treated with various concentrations of Berberis integerrima (A) alcoholic and (B) aqueous extracts.
Significant differences were designated as *p < 0.05.
SD: Standard deviation.
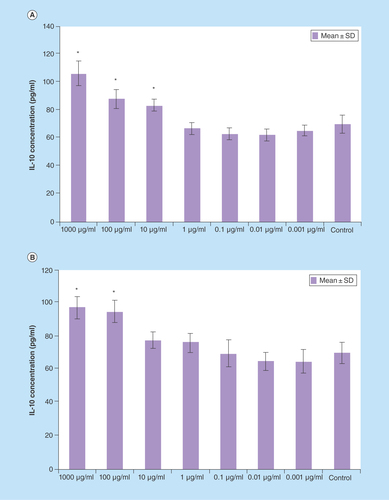
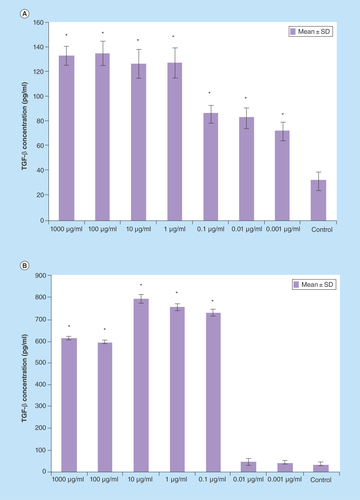
Figure 6. TGF-β production of splenocytes treated with various concentrations of Berberis integerrima (A) alcoholic and (B) aqueous extracts.
Significant differences were designated as *p < 0.05.
SD: Standard deviation.