
Figures & data
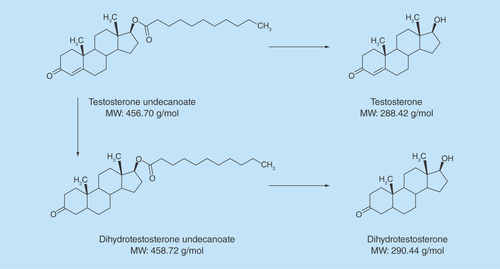
Figure 2. Testosterone and dihydrotestosterone NaF/Na2 ethylenediaminetetraacetate plasma versus serum mean concentrations.
DHT: Dihydrotestosterone.
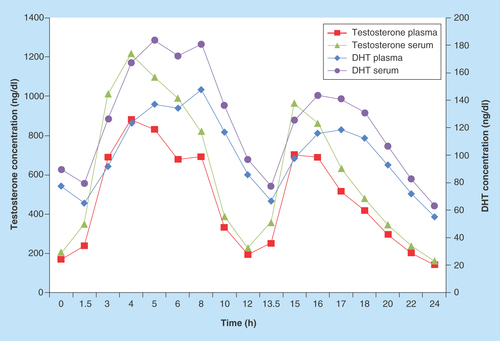
Table 1. Conversion of testosterone undecanoate into testosterone according to the testosterone undecanoate concentrations and the incubation time.
Table 2. Conversion of testosterone undecanoate into testosterone in whole blood collected with different collection tubes and endogenous level of testosterone in different collection tubes.
Table 3. Comparison of testosterone endogenous levels between serum and plasma with NaF/Na2 ethylenediaminetetraacetate and NaF/K2C2O2 in different donors.
Table 4. Testosterone and phosphate buffer saline concentrations in serum or plasma harvested from blood spiked with testosterone undecanoate working solution prepared in phosphate buffer saline or methanol; spiking level 60,000 ng/dl.
Table 5. Pharmacokinetic results obtained from serum and NaF-Na2 ethylenediaminetetraacetate plasma.
Supplemental material