
Figures & data
Figure 1. Representative standard curves constructed with 1:10 scalar dilutions (5000 to 5 pg per reaction tube) of purified human genomic DNA.
Curve (A) (Y = -3.24X + 31.32; R2 = 0.996) was constructed with human gDNA only; curve (B) (Y = -3.27X + 34.69; R2 = 0.995) and curve (C) (Y = -3.34X + 33.59; R2 = 0.998) were constructed with the addition of 2 µl of medium G-1 PLUS and G-2 PLUS, respectively.
Ct: Threshold cycle; gDNA: Genomic DNA.
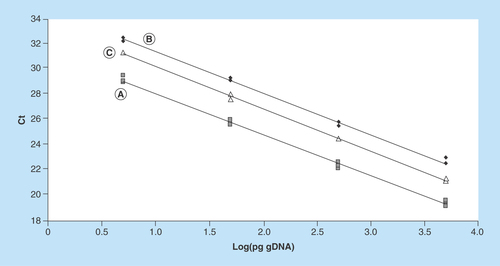
Table 1. Detection and quantification of genomic DNA in spent medium samples at day 3 and day 5/6 through TBC1D3 amplification.
Table 2. TBC1D3 and/or TSPY1 amplification from different matrices of the same embryos.
Table 3. MTHFR C677T genotyping results from medium samples.
Table 4. MTHFR C677T genotyping results from blastocoele fluid samples.