Figures & data
Figure 1. Molecules employed in this study.
CHI: Chitosan; GEN: Genipin; PEDOT: Poly(3,4-ethylenedioxythiophene); PEDOT-S: Sulfonated PEDOT derivative; PSS: Polystyrenesulfonate.
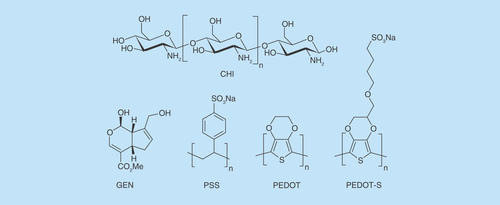
Figure 2. Adhesion and growth of human dermal fibroblasts on various surfaces up to 4 days in culture.
(A) Tissue culture plate controls. (B) PEDOT-PSS-based multilayer films. (C) PEDOT-S-based multilayer films. Cells were stained with a LIVE/DEAD® Viability/Cytotoxicity Kit, live cells were green and dead cells were red. Scale bars represent 250 µm. (D) Cell viability after 4 days in culture as determined with a LIVE/DEAD® Viability/Cytotoxicity Kit. (E) Number of cells adhered to the substrates after 2 days (grey bars) or 4 days (black bars) as estimated by the AlamarBlue® assay. Error bars represent standard deviations (n = 3).
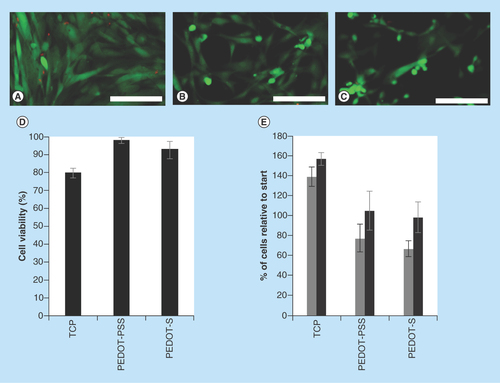
Figure 3. (A) Experimental setup for electrical stimulation of PEDOT-based films (not to scale). (B) Cell alignment and length assessment.
CE: Counter electrode; CT: Copper tape; PCW: Polycarbonate well; RE: Reference electrode; WE: Working electrode.
Adapted with permission from [Citation33] © 2015 Hardy JG et al.
![Figure 3. (A) Experimental setup for electrical stimulation of PEDOT-based films (not to scale). (B) Cell alignment and length assessment.CE: Counter electrode; CT: Copper tape; PCW: Polycarbonate well; RE: Reference electrode; WE: Working electrode.Adapted with permission from [Citation33] © 2015 Hardy JG et al.](/cms/asset/c8b83976-33c3-45fe-bf5a-ce948c59eae8/ifso_a_12363866_f0003.jpg)
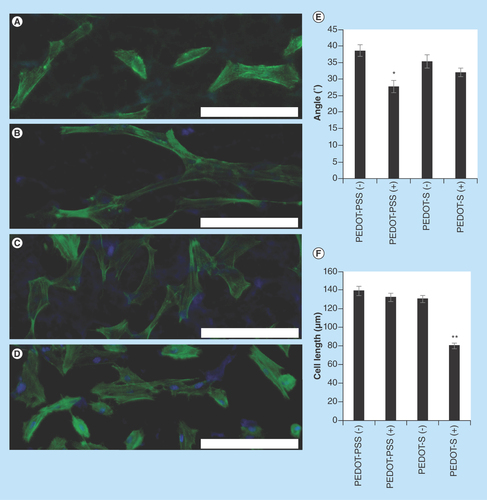
Figure 4. Analysis of the morphology of human dermal fibroblasts on various surfaces with optional electrical stimulation (applied in line with the dipping direction and horizontally relative to the images presented).
(A) PEDOT-PSS-based multilayer films without electrical stimulation, PEDOT-PSS(-). (B) PEDOT-PSS-based multilayer films with electrical stimulation, PEDOT-PSS(+). (C) PEDOT-S-based multilayer films without electrical stimulation, PEDOT-S(-). (D) PEDOT-S-based multilayer films with electrical stimulation PEDOT-S(+). DAPI-stained nuclei are blue and Alexa Fluor® 488-stained actin is green. Scale bars represent 200 µm. (E) Assessment of cell alignment. (F) Assessment of cell length. Error bars represent standard errors of the mean (n = 150 or more).
*p ≤ 0.01, **p < 0.001.