Figures & data
Figure 1. Effects of IKVAV-membrane-spanning peptide treatment on neurological status with daily assessment for 28 days following spinal cord clip compression injury.
Two-way ANOVA followed by Tukey’s multiple comparison test revealed a significant improvement in locomotor control compared with peptide alone on days 11–28 (p ≤ 0.05) and IKVAV alone on days 11–28 (p ≤ 0.05).
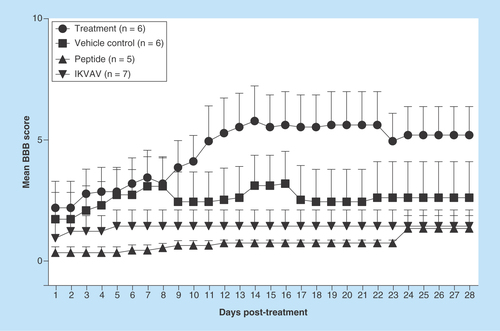
Figure 2. Effects of IKVAV-membrane-spanning peptide treatment on protoplasmic astrocyte number within the area of injury for each group of mice.
Three fields were viewed, enumerated and averaged for each mouse. *** denotes significantly increased numbers of astrocytes compared with all groups except the Peptide group (p < 0.001).
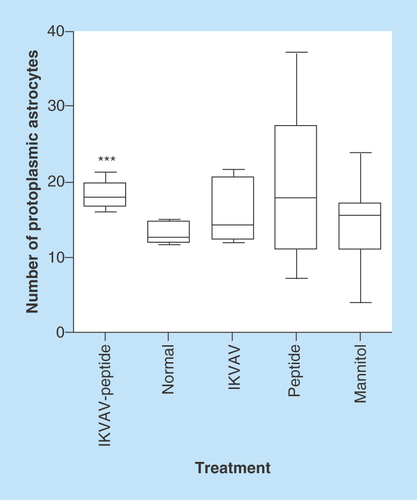
Figure 3. Effects of IKVAV-membrane-spanning peptide treatment on neuron size.
Graph shows mean neuron size at 4 weeks after SCI for all animals determined by measurement of 6 neurons per mouse within the region of interest. * denotes that IKVAV-MSP differed from all others at p < 0.05. The pictures presented in A-E shows the comparison between representative groups at light under 400X magnification (1) and electron microscope (2) level. In IKVAV-Peptide group (A), the large neurons are obvious and actually larger compared with Normal (B); however, in control groups IKVAV (C), Peptide (D) and Mannitol (E) the neurons are shrunken and in some cases pyknotic.
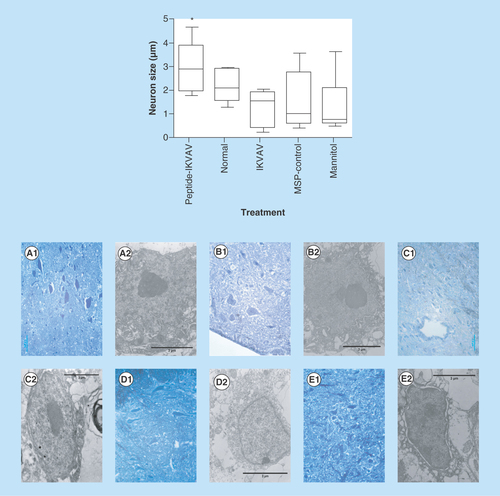
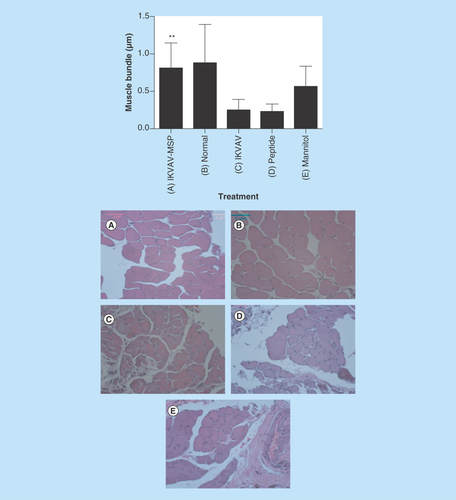
Figure 4. Effects of IKVAV-MSP on muscle bundle size determined from enumeration of 10 fields from both right and left legs for each mouse.
** denotes a significant difference between representative treatment and control groups (p < 0.01). Comparison of muscle bundles in IKVAV-MSP treated (A), normal untreated (B) and control treated groups (C–E, IKVAV, Peptide and Mannitol treatment, respectively). Histological images are H&E X400.