
Figures & data
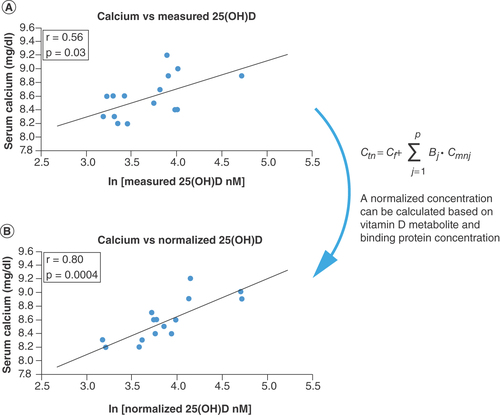
Figure 1. Comparison of the correlations between bone mineral density.
(A) Measured 25(OH)D, and (B) normalized 25(OH)D; each point represents one set of measurements from one volunteer; measured vitamin D was obtained by direct analysis of the blood sample; normalized vitamin D was obtained from measured vitamin D and the concentration of binding proteins; the line represents the best linear fit.
BMD: Bone mineral density.
Adapted with permission from [Citation13].
![Figure 1. Comparison of the correlations between bone mineral density.(A) Measured 25(OH)D, and (B) normalized 25(OH)D; each point represents one set of measurements from one volunteer; measured vitamin D was obtained by direct analysis of the blood sample; normalized vitamin D was obtained from measured vitamin D and the concentration of binding proteins; the line represents the best linear fit.BMD: Bone mineral density.Adapted with permission from [Citation13].](/cms/asset/ca2affd6-4fd4-4e90-905d-e56f1410896f/ifso_a_12363869_f0006.jpg)
Figure 2. Measured concentration of total 25(OH)D and the resulting normalized concentration of 25(OH)D calculated with Equation 2.
(A) Healthy and (B) CKD volunteers; each point represents one set of measurements from one volunteer; measured vitamin D was obtained by direct analysis of the blood sample; normalized vitamin D was obtained from measured vitamin D and the concentration of binding proteins; the line represents the best linear fit.
CKD: Chronic kidney disease.
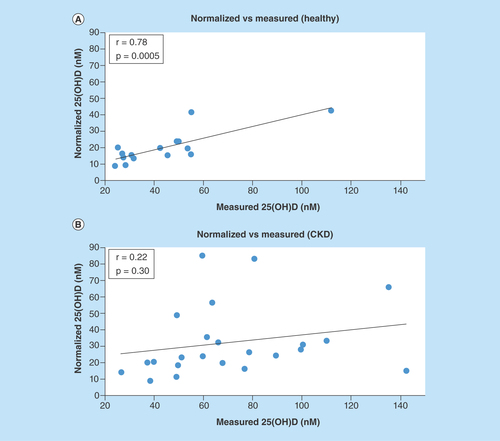
Figure 3. Correlation of serum calcium with ln(25(OH)D) for the healthy subjects.
(A) Measured and (B) normalized metabolite concentration; each point represents one set of measurements from one volunteer; measured vitamin D was obtained by direct analysis of the blood sample; normalized vitamin D was obtained from measured vitamin D and the concentration of binding proteins; the line represents the best linear fit.
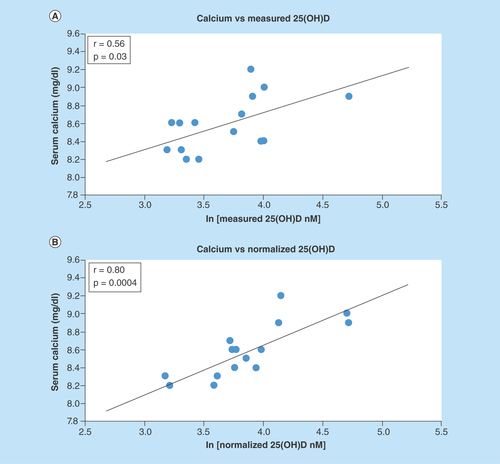
Table 1. The binding constants of vitamin D3 metabolites to vitamin D binding protein and albumin [Citation32,Citation33].
Table 2. Demographic information for the study groups.
Table 3. Correlations between 25(OH)D and characteristics of the healthy subjects.
Table 4. Correlations between 25(OH)D and characteristics of the chronic kidney disease study population.
Table 5. Correlations between 1,25(OH)2D and characteristics of the chronic kidney disease study population.