Figures & data
Figure 1. Chemical structures of analyte and internal standard.
Chemical structures of (A) imatinib (B) imatinib-D4.
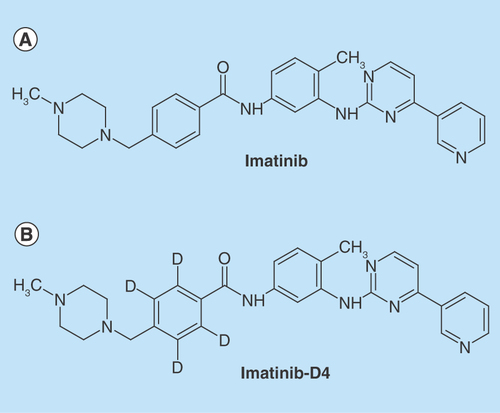
Figure 2. Tandem mass spectrometric scan of analyte and internal standard.
(A) Parent ion (Q1) scan of imatinib; (B) product ion (MS/MS) scan of imatinib; (C) parent ion (Q1) scan of imatinib-D4; (D) iroduct ion (MS/MS) scan of imatinib-D4. amu: Atomic mass unit; cps: Counts per second; MS/MS: Tandem mass spectrometry.
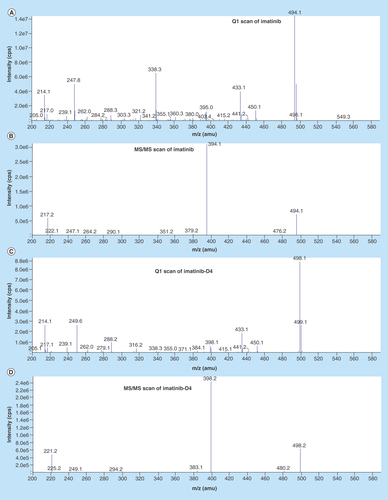
Figure 3. Chromatograms.
(A) Chromatogram of blank at retention time of imatinib, (B) chromatogram of blank at retention time of imatinib-D4, (C) chromatogram of subject sample predose, (D) chromatogram of subject sample predose-imatinib-D4, (E) chromatogram of LOQ – imatinib, (F) chromatogram of LOQ – imatinib-D4, (G) chromatogram of ULOQ – imatinib, (H) chromatogram of ULOQ – imatinib-D4. LQC:Low quality control; ULOQC: Upper limit of quantification.
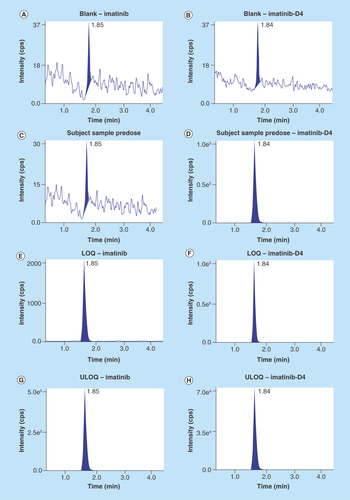
Figure 4. Calibration curve of imatinib.
Method was found to be linear in the range 9.57–4513.29 ng/ml.
IS: Internal standard.
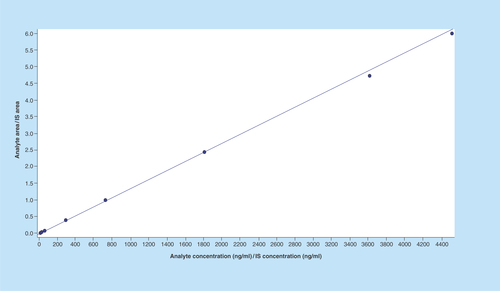
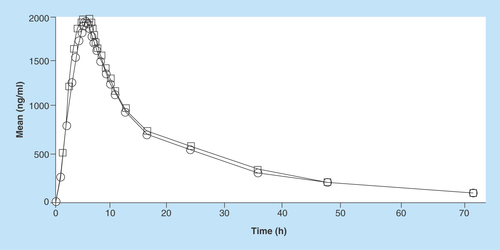
Figure 5. Pharmacokinetic profile of imatinib (test and reference) in Indian volunteers.
Circle: Reference; Rectangle: Test.