Figures & data
Figure 1. Effect of Nps on the viability of NCI H460 cells.
Cells were allowed to grow until they reached the exponential phase. (A) TiO2, CeO2 and Al2O3 NPs were added (indicated with an arrow) at different concentrations: 15.6 (violet line), 31.25 (blue line), 62.5 (pink line), 125 (dark blue line), 250 (green line) and 500 μg/ml (red line). (B) ZnO Nps were added (indicated with an arrow) at different concentrations: 12.5 (violet line), 25 (blue line), 37.5 (pink line), 50 (dark blue line), 75 (green line) and 100 μg/ml (red line). The calculated LD50 was around 50 μg/ml.
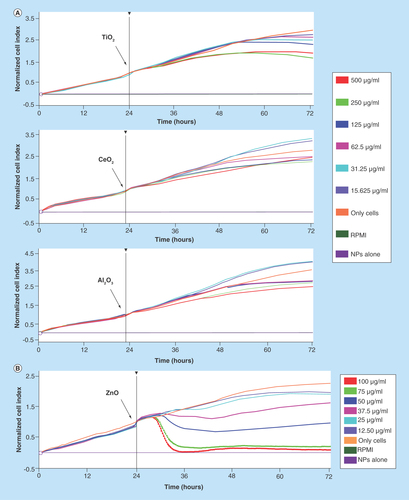
Figure 2. Activation of the MAPK (p-ERK1/2, p38 and p-SAPK/JNK) and the NFκB pathways induced by CeO2, TiO2, Al2O3 and ZnO Nps in the NCI-H460 lung cell line.
The activation of the MAPK and NFκB pathways was studied by western blot. The expression of phosphorylated (p) proteins (p-ERK1/2, p-38 and p-SAP/JNK) is indicated at different time points (1, 3 and 6 h). All Nps were tested at 100 μg/ml, except for ZnO (50 μg/ml). The numbers in the figure correspond to the molecular weight of the protein marker and GAPDH was used as a loading control (bands indicated with arrows). The activation of the NFκB pathway was analyzed as the degradation of the IκBα inhibitor by western blot and normalized to the controls (C, untreated sample) at different times (1, 3 h).
*Statistically significant differences (p < 0.05) in the protein level compared with the control.
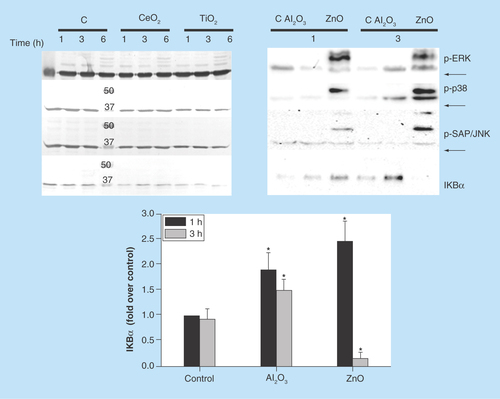
Figure 3. Expression of the MAPK and IκBα protein in NCI-H460 cells incubated with low concentrations of CeO2, TiO2, Al2O3 and ZnO Nps.
The activation of the MAPK and NFκB pathways was studied by western blot at two different time points (1 and 3 h). All Nps were tested at 10 μg/ml, except for ZnO Nps (5 μg/ml). The expected bands corresponding to the phosphorylated p-ERK1/2, p-38 and p-SAP/JNK are indicated, but they were not detected in the NCI-H460 cell line at these Np concentrations. GAPDH was used as a loading control and the bands are indicated with arrows. The activation of the NFκB pathway was analyzed by the degradation of the IκBα inhibitor.
*Statistically significant differences (p < 0.05) in the protein level compared with the control.
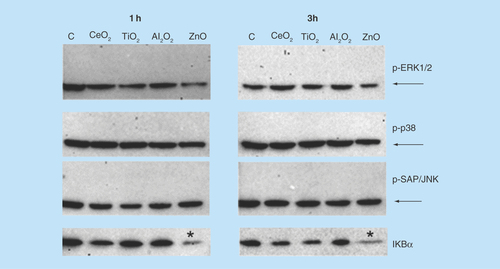
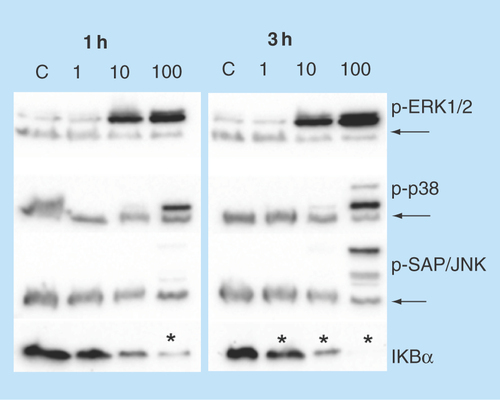
Figure 4. Influence of the Zn2+ ion concentration on the activation of the MAPK and NFκB pathways in NCI-H460 cells.
The activation of the MAPK and NFκB pathways in NCI-H460 cells was studied by western blot at two different time points (1 and 3 h) and at three different concentrations (1, 10 and 100 µg/ml) of Zn2+ ions. The expression of phosphorylated (p) proteins (p-ERK1/2, p-38 and p-SAP/JNK) is indicated along with the degradation of the IκBα inhibitor. GAPDH was used as a loading control and the bands are indicated with arrows.
Statistically significant differences (p < 0.05) in the protein level compared with the control.