Figures & data
Figure 1. Phenotypes of frailty.
Presence of 0–1 phenotype = not frail, two phenotypes = pre-frail, ≥three phenotypes = frail [Citation5].
![Figure 1. Phenotypes of frailty.Presence of 0–1 phenotype = not frail, two phenotypes = pre-frail, ≥three phenotypes = frail [Citation5].](/cms/asset/03fad91d-b422-4dee-bd99-4f2209ae2ca5/ifso_a_12363887_f0001.jpg)
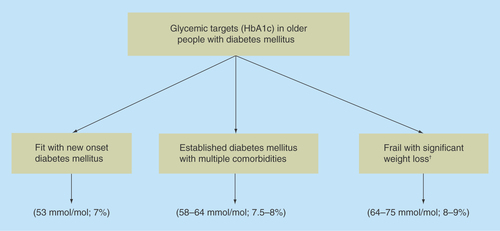
Figure 2. Glycemic targets in older people with diabetes mellitus.
†Short-term targets of daily blood glucose monitoring between >4 but <15 mmol/l are more relevant than the long-term HbA1c due to the limited life expectancy in this population group.