Figures & data
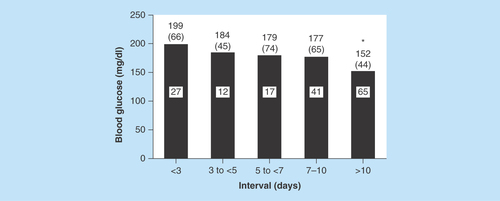
Figure 1. Distribution of patients according to intervals.
Left: interval between date of preoperative medical evaluation and date of surgery. Right: interval between date of hemoglobin A1c measurement and date of surgery.
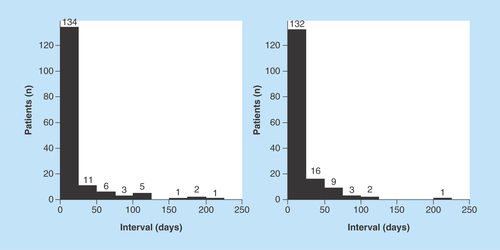
Figure 2. Preoperative point-of-care blood glucose levels according to intervals.
Intervals are the number of days between the date of the preoperative medical evaluation and the day of surgery. The numbers above the bars indicate mean (SD) blood glucose values, and the numbers within the bars indicate the number of patients in each interval (a glucose value was missing for one patient). The asterisk indicates a significant difference (p < .01) between the mean blood glucose value for the <3-day interval and the >10-day interval.