Figures & data
Figure 2. Graph representative of microscopic structures changes on SEM. Comparisons between the experimental groups with the control group identifying significant difference on the group 5 observing all teeth structures as enamel, dentin, pulp and cementum.
The differences were measured with respect to direct comparison with the control group (group 1), presence or absence of pulp, preservation or destruction of the dentine structure, enamel and cementum, presence or absence of cracks in the cement region.
*p = 0.0112.
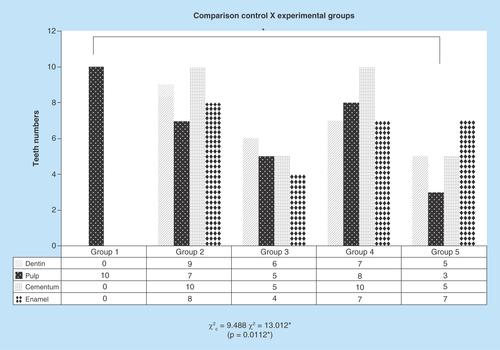
Figure 3. Mass loss delta%.
All experimental groups have had mass loss during 10 weeks. On the experimental groups, the group 2 and 4 had more mass loss and both were under sodium hypochlorite solution.
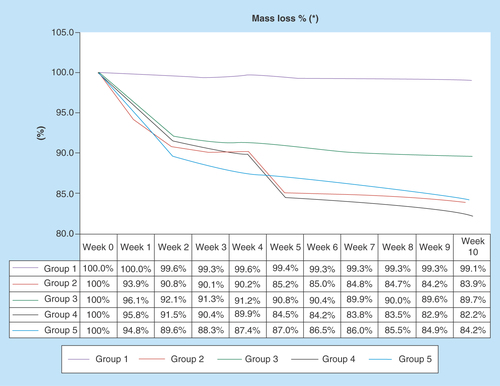
Figure 4. Color analysis table.
All samples showed changes in color, with high level of significance. All experimental groups have modified their color, except the control group. Figure shows the VITA® scale.
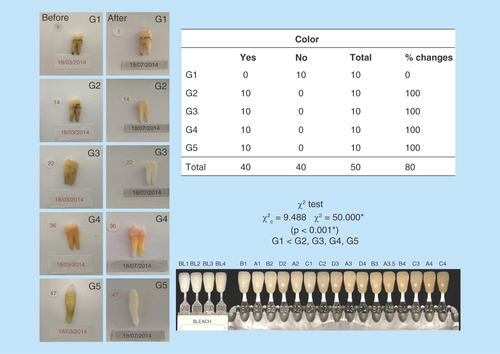
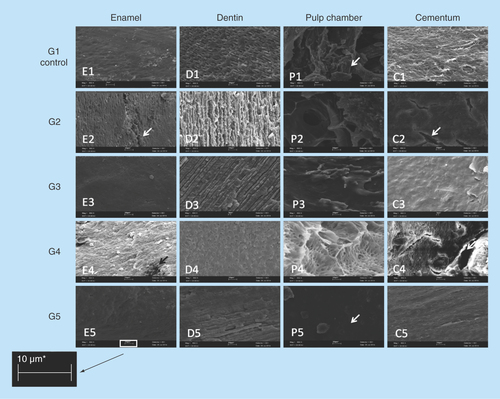
Figure 5. SEM images of changes comparing structures as enamel, dentine, pulp chamber and cementum in groups (950×, 10 μm).
Analysis on SEM images from different dental tissues, enamel, pulp, cementum and dentin. G1 (control group) and then other four experimental groups. The arrows identified on pictures E2 and C2 the presence of crackers; on the picture P1 the pulp presence can be identified and on the picture P5 the pulp absence can be observed. The image revealed the absence of biological residue on the group 5 probing hydrogen peroxide and enzymatic detergent the best solution for decellularization.