
Figures & data
Figure 1. Concentrated growth factors.
(A) Three blood fractions were obtained through centrifuge process (1) a superior phase represented by the serum; (2) an interim phase represented by a very large and dense polymerized fibrin block containing the CGFs, white blood cells and stem cells; and (3) the lower red blood cell layer. (B) CGFs separated from platelet-poor plasma.
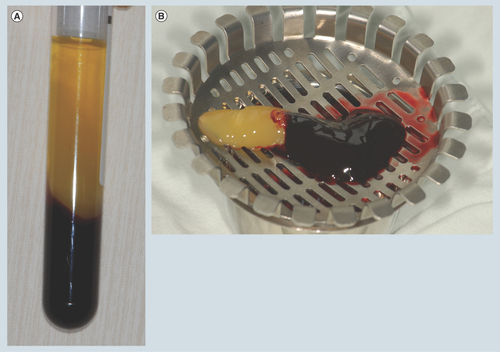
Figure 2. (A) An example in the experimental group: the second right mandibular premolar, baseline. (B) Intra-surgical findings. (C) Mixture of CGFs and BPBM granules was placed into the defect. (D) CGFs membrane was placed. (E) Flap sutured. (F) 1 year post-surgery.
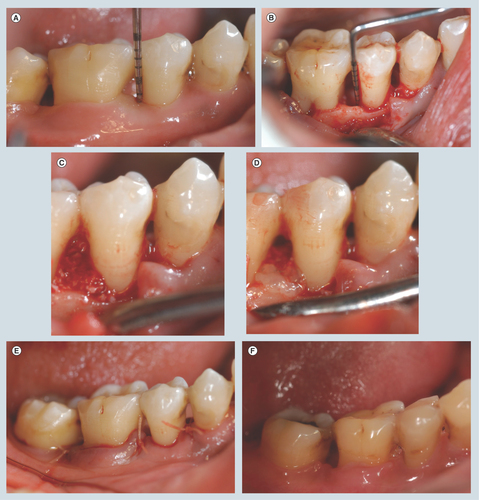
Figure 3. Radiographic landmarks.
AC: Alveolar crest; BD: Base of the defect; CEJ: Cemento–enamel junction.
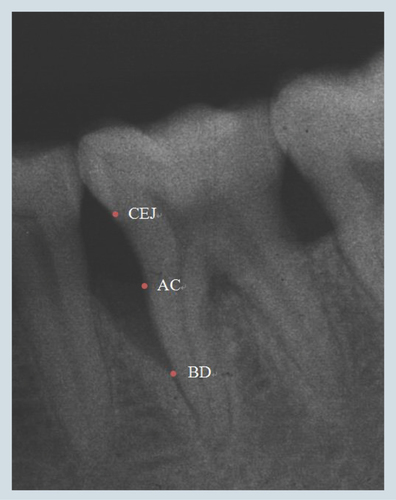
Figure 4. Periapical radiograph of the second right mandibular premolar 1 year post-surgery.
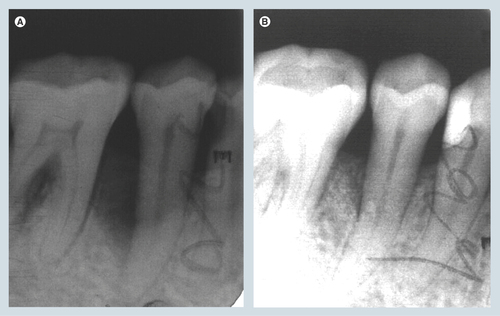
Table 1. Distribution and type of treated intrabony defects.
Table 2. Mean intrabony defect characteristics in surgery.
Table 3. Mean plaque index and bleeding index at baseline and 1 year post surgery.
Table 4. Clinical parameters at baseline and 1 year post surgery.
Table 5. Number of sites and percentage of clinical attachment level gain ≥3 mm in test and control groups.
Table 6. Mean radiographic measurements of test and control groups.
Table 7. The levels of growth factors in platelet poor plasma and concentrated growth factors.