
Figures & data
Figure 1. Globotriaosylceramide acyl chain analysis.
(A) Glycosphingolipids were extracted from frozen tissues, separated by UPLC, and Gb3 acyl chain species were analyzed by MS. All analyzed species varying in chain length, saturation and hydroxylation were significantly elevated in Fabry mice relative to wild-type (WT). (B) Most N-methylated Gb3 species analyzed were undetectable in WT tissues, with elevated levels observed in most Fabry tissues. Dark, open and striped bars correspond to WT, Fabry and MF, respectively.
*,+ p < 0.05; **,++ p < 0.01; ***,+++ p < 0.001 based on the student’s t-test (*) or one-way ANOVA followed by the Bonferroni post-test (+); n = 4.
ANOVA: Analysis of variance; Gb3: Globotriaosylceramide; MF: MDR1a/b/Fabry mouse; MS: Mass spectrometry.
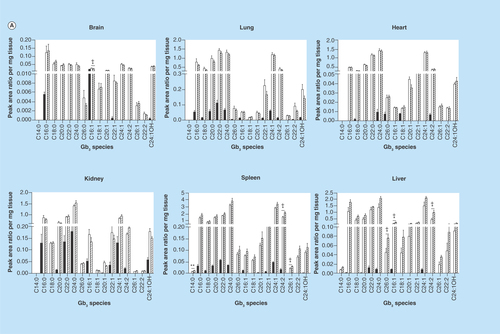
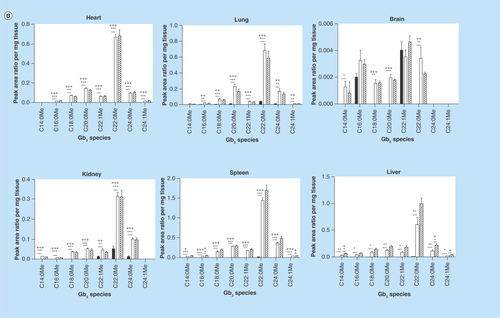
Figure 2. Dihexosylceramide acyl chain species analysis.
Glycosphingolipids were extracted from frozen tissues, separated by HPLC, and DHC acyl chain species were analyzed by MS. DHC expression profiles vary based on tissue. DHC species are either elevated or unchanged in MF relative to Fabry mouse tissues. Dark, open and striped bars correspond to wild-type, Fabry and MF, respectively.
*,+ p < 0.05; **,++ p < 0.01; ***,+++ p < 0.001 based on the student’s t-test (*) or one-way ANOVA followed by the Bonferroni post-test (+); n = 4.
ANOVA: Analysis of variance; DHC: Dihexosylceramide; MF: MDR1a/b/Fabry mouse.
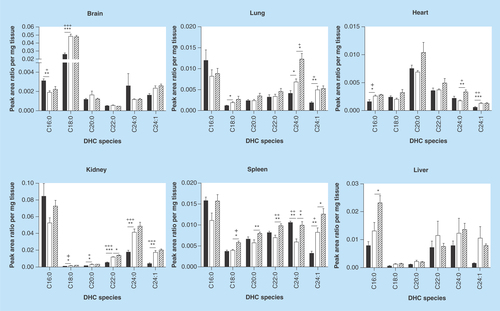
Figure 3. Monohexosylceramide acyl chain species analysis.
Glycosphingolipids were extracted from frozen tissues, separated by HPLC, and MHC acyl chain species were analyzed by MS. MHC expression profiles show tissue-specific patterns. All species in all tissues are increased in Fabry mice relative to wild-type. MHC levels are either reduced or unchanged in MF relative to Fabry mouse tissues. Dark, open and striped bars correspond to wild-type, Fabry and MF, respectively.
*,+ p < 0.05; **,++ p < 0.01; ***,+++ p < 0.001 based on the student’s t-test (*) or one-way ANOVA followed by the Bonferroni post-test (+); n = 4.
ANOVA: Analysis of variance; MF: MDR1a/b/Fabry mouse; MHC: Monohexosylceramide; MS: Mass spectrometry.
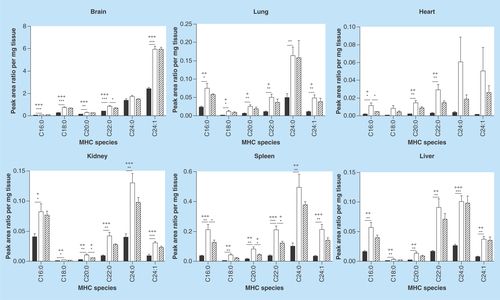
Figure 4. Ceramide acyl chain species analysis.
Glycosphingolipids were extracted from frozen tissues and separated by HPLC. Ceramide acyl chain species were analyzed by MS. A reduction in ceramides was observed in the Fabry spleen relative to wild-type. No significant changes were seen between MF and Fabry tissue ceramides. Dark, open and striped bars correspond to wild-type, Fabry and MF, respectively.
*,+ p < 0.05; **,++ p < 0.01; ***,+++ p < 0.001 based on the student’s t-test (*) or one-way ANOVA followed by the Bonferroni post-test (+); n = 4.
ANOVA: Analysis of Variance; MF: MDR1a/b/Fabry mouse.
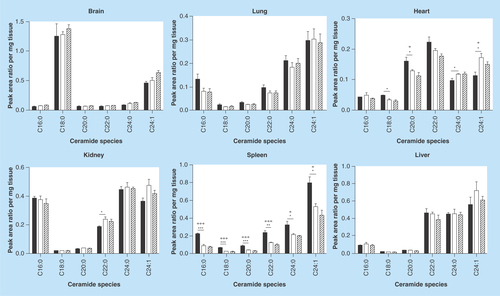
Figure 5. mRNA levels of genes involved in glycosphingolipid metabolism.
Transcript levels in the liver of WT and Fabry mice were assessed by real-time quantitative reverse-transcription PCR. Data shown are normalized to endogenous housekeeping control genes (actin and/or GAPDH) and expressed as fold-change relative to WT. A significant decrease in Plekha8 and B4Galt5 was observed in the Fabry liver.
WT: Wild-type.
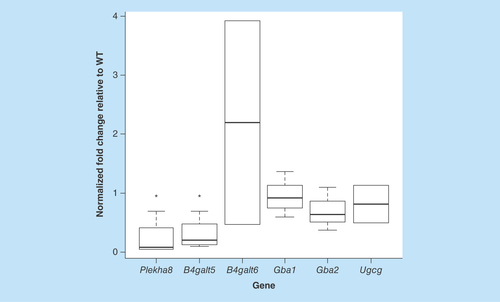
Figure 6. Tissue-wide accumulation of globotriaosylceramide in Fabry mice.
Tissue globotriaosylceramide levels were evaluated by histochemical staining using verotoxin. Sections were treated with MCD to deplete cholesterol. Staining was markedly higher in Fabry tissues and was observed throughout the tissue sections.
MCD: Methyl-β-cyclodextrin; WT: Wild-type.
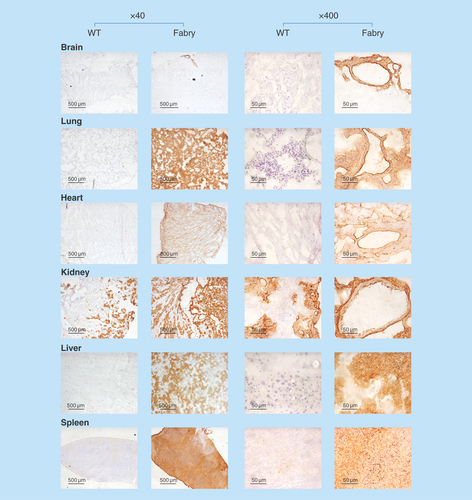
Table 1. Tissue globotriaosylceramide species percent composition.
Table 2. MF mouse tissue glycosphingolipid fold-change relative to Fabry.
Table 3. Fabry mouse tissue sphingolipid fold-change relative to wild-type.
Table 4. Tissue dihexosylceramide species percent composition.
Table 5. Tissue monohexosylceramide species percent composition.