
Figures & data

Figure 1. Group division and treatment protocol of in vivo animal studies.
Aqueous solution of NP: OD430 = 0.5; Silymarin concentration: 70 mg/ml.
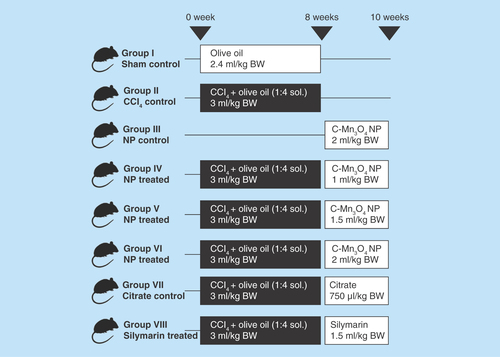
Figure 2. Effect of acid treatment on physicochemical characteristics of C-Mn3O4 nanoparticles.
(A) TEM image of nanoparticle (NP) at pH 7.4. (B) HRTEM image of NP at pH 7.4. (C) Size distribution of NPs at pH 7.4. (D) TEM image of acid treated (pH 3.6) NP. (E) HRTEM image of acid treated (pH 3.6) NP. (F) Size distribution of acid treated (pH 3.6) NPs. (G) Change in absorbance of NPs due to acid treatment. (H) Change in absorbance at 430 nm of NPs during acid treatment and stability after acid treatment.
HRTEM: High-resolution TEM; TEM: Transmission electron microscopy.
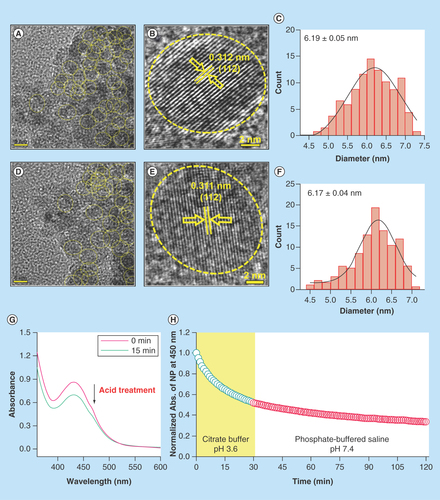
Figure 3. Physico-chemical characteristics of C-Mn3O4 nanoparticles.
(A) Change in percentage of bilirubin degradation by nanoparticles due to acid treatment. (B & C) Recyclability of the catalyst before and after acid treatment, respectively. (D) Comparative representation of reactive oxygen species generation capability of nanoparticles due to acid treatment. (E & F) Change in reactive oxygen species generation ability due to acid treatment in presence of sodium azide. (G) Percentage antioxidant activity as measured by DPPH• assay.
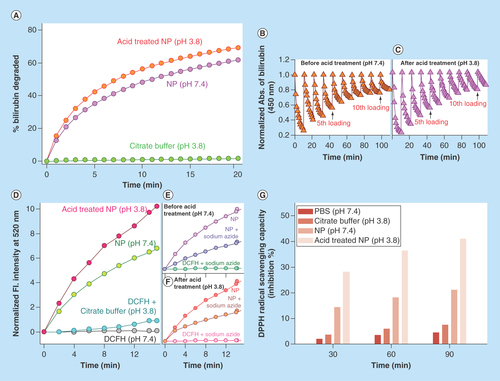
Figure 4. Effect of nanoparticles on various physiological parameters.
(A) Effect on total bilirubin level. Single dose of nanoparticles was able to restore serum bilirubin to almost normal level up to 12 h from hyperbilirubinemia condition. Then it again starts to increase, indicating need for twice a day administration of nanoparticles. (B & C) Daily intake of water and food, respectively. (D) Change in body weight throughout the experimental period. (E) Relative liver weight (liver weight/body weight) after sacrifice.
*Values differ significantly from sham control group (Group I) (*p < 0.001).
**Values differ significantly from CCl4-treated group (Group II) (**p < 0.05).
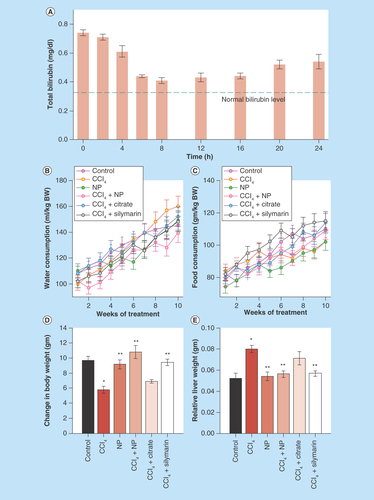
Figure 5. Effect of nanoparticles on hepatic morphological analysis in CCl4-intoxicated mice.
(A) Representative photographs of liver after the experimental period. (B) Hematoxylin and eosin stained liver sections under microscope of Group I–VIII. (C & D) Ishak modified hepatic activity index and METAVIR scoring for necro-inflammatory staging, respectively. Maximal score possible for Ishak HAI is 16, and for METAVIR is 3.
*: Increased mitotic activity; →: Hemorrhage; CV: Central vein; HAI: Hepatic activity index; MI: Mononuclear infiltration; Ne: Necrosis, V: Vacuolation.
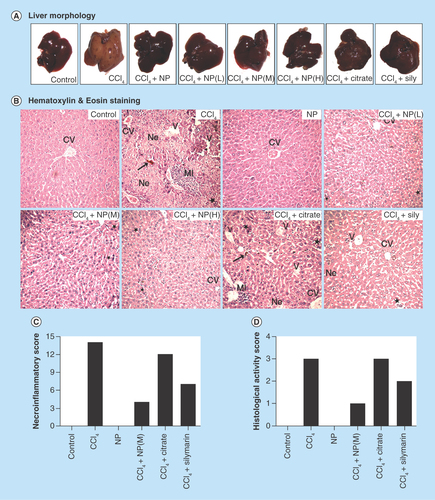
Figure 6. Effect of nanoparticles on CCl4-induced hepatic fibrosis.
(A) Masson’s trichrome stained liver sections under microscope. CCl4-treated group shows marked fibrous septa (portal to potal bridging) however other groups except Citrate show no signs of fibrosis. (B) Fibrosis score of different groups as calculated by RGB analysis from MT staining. (C) α-SMA immunohistochemistry. Portal arears showed high immunoreactivity in case of CCl4 treated mice. (D) α-SMA positive area as quantified with ImageJ. (E) Sirius red stained liver sections. CCl4 treated group shows fibrous expansion of portal areas with portal to portal and occasional portal to central bridging. (F) Red stained collagen content as calculated by ImageJ. (G & H) Ishak and modified Ishak fibrosis scoring. Highest possible scores are 6 and 4, respectively. (I) Hepatic hydroxyproline content.
*Values differ significantly from sham control group (Group I) (*p < 0.001).
**Values differ significantly from CCl4-treated group (Group II) (**p < 0.05).
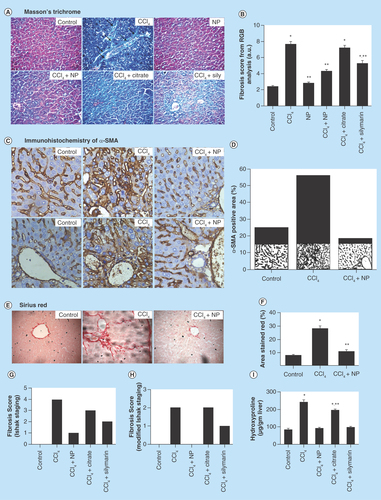
Figure 7. Effects of orally treated C-Mn3O4 nanoparticles on liver SOD, catalase, GPx, GSH and MDA content in CCl4 intoxicated mice.
(A) Serum MDA content. (B) MDA content from liver homogenate. (C) SOD activity. (D) Catalase activity. (E) GSH level. (F) GPx activity.
*Values differ significantly from sham control group (Group I) (*p < 0.001).
**Values differ significantly from CCl4-treated group (Group II) (**p < 0.05).
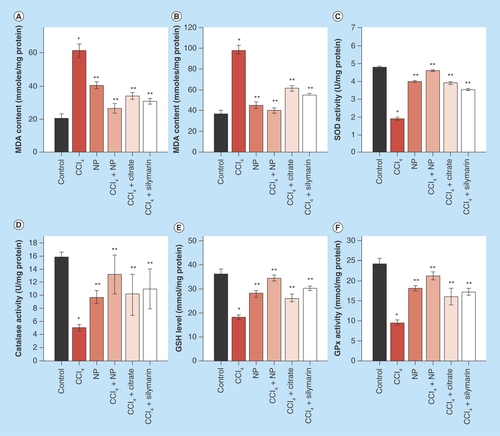
Figure 8. Effect of C-Mn3O4 nanoparticles on mitochondria.
(A) Complex IV activity. (B) Effect on mitochondria permeability transition, measured as decrease in absorbance at 50 nm. (C) Change in mitochondrial membrane potential. In CCl4-treated mice fluorescence of rhodamine 123 was recovered by 40% compared with control, indicative of decrease in mitochondrial membrane potential (ΔΨm). Treatment with C-Mn3O4 nanoparticles partially restored the potential.
*Values differ significantly from sham control group (Group I) (*p < 0.001).
**Values differ significantly from CCl4-treated group (Group II) (**p < 0.05).
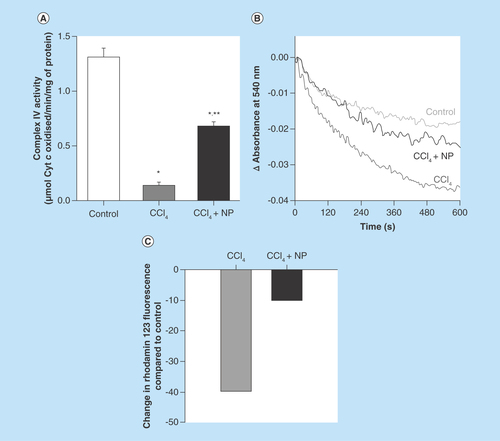
Figure 9. Schematic representation of the nano-therapy using C-Mn3O4 nanoparticles.
Oral administration of C-Mn3O4 nanoparticles recovers liver from severe fibrotic damage caused by chronic CCl4 administration. Acidic condition in stomach increases the antioxidant activity of C-Mn3O4 nanoparticle which in turn reduces the oxidative stress and subsequent recovery of liver takes place.
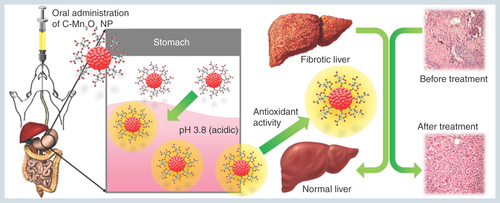
Table 1. Effect of C-Mn3O4 nanoparticle on liver function parameters of CCl4 intoxicated mice.
Table 2. Summary of hematology parameters studied across the groups.