
Figures & data
Figure 1. Correlation of the test methods revealed a correlation coefficient of 0.949.
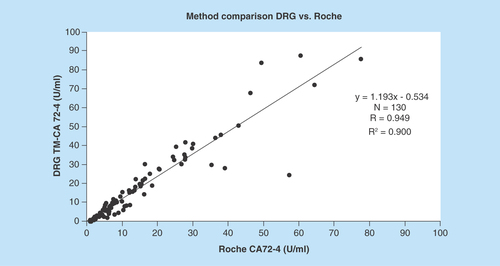
Figure 2. The Bland Altman blot illustrates the correlation in terms of deviations from mean and standard deviations.
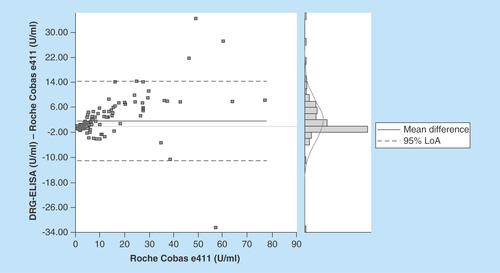
Table 1. Correlation of clinical data of 134 patients with epithelial ovarian cancer with results of the DRG TM-CA 72–4 ELISA assay.
Table 2. Details on results of the DRG TM-CA 72–4 ELISA assay using 6 test samples and 2 controls (80 repeated measures per sample).
Table 3. Details on the method comparison of Roche Cobas e411 and TM-CA 72–4 ELISA.
Table 4. Details on the method comparison of Roche Cobas e411 and TM-CA 72-4 ELISA Part II.