
Figures & data
Figure 1. Basal mRNA expression of biomarkers in prostate cancer cells.
Expression was assessed by quantitative RT-PCR and normalized to TBP. Data represent means + SEM, N = 3. * p < 0.05, ** p < 0.01 and *** p < 0.001 compared with HPrEC. HPrEC: Normal, human, primary prostate epithelial cells; FLNA: Filamin-A; FLNB: Filamin-B; KRT19: Keratin-19; RT-PCR: Real-time PCR; SEM: Standard error of the mean; TBP: TATA-binding protein.
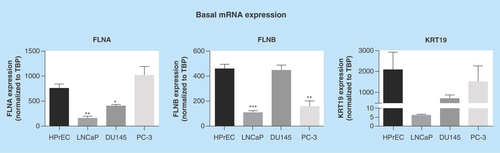
Figure 2. Regulation of biomarkers by prostate cancer-relevant stimuli in vitro.
Cells were exposed to hypoxia (1% oxygen; A), TNFα (10 ng/ml; B) or R1881 (1 nM; C) for 24 h. Expression was assessed by quantitative RT-PCR and normalized to TBP. Data represent means ± SEM, N = 3. * p < 0.05 and ** p < 0.01 compared with normoxia or control. FLNA: Filamin-A; FLNB: Filamin-B; KRT19: Keratin-19; RT-PCR: Real-time PCR; SEM: Standard error of the mean; TBP: TATA-binding protein.
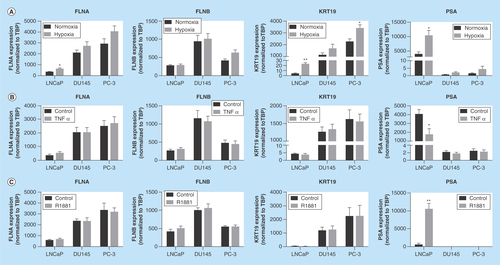
Figure 3. Secretion of biomarkers from prostate cancer cells.
Conditioned media from cells were harvested and proteomic analysis was performed. Data represent means ± SEM, N = 3.
FLNA: Filamin-A; FLNB: Filamin-B; KRT19: Keratin-19; PSM: Peptide spectral match; SEM: Standard error of the mean.
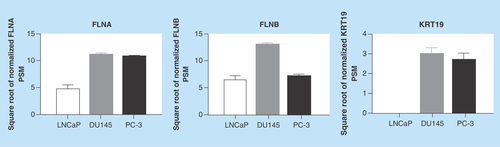
Figure 4. Detection of filamin-A and -B in human plasma.
ELISA was used to detect FLNA and FLNB levels in blood samples from patients with suspected prostate cancer. (A) Scatterplot representation of FLNA, FLNB and PSA levels in patients. (B) Correlation analysis of FLNA and FLNB in patients with benign cases or adenocarcinoma. FLNA: Filamin-A; FLNB: Filamin-B; PSA: Prostate-specific antigen.
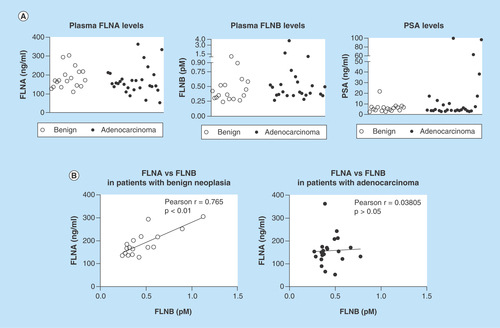
Table 1. Patient demographics.
Table 2. Biomarker ranking in PC-3 cells using Burt’s constraint.