
Figures & data
Figure 1. Representative structures of lipids.
PGE2 and PGD2 are structural isomers of each other. 2-AG is an endocannabinoid known to be regulated in neuropathic pain. TXB2 and LTB4 are known proinflammatory mediators which play a significant role in nerve root dysfunction.
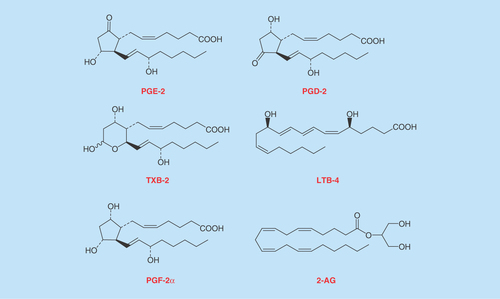
Figure 2. Representative extracted ion chromatograms of lipids.
All lipids were base line resolved under <5 min with a gradient elution using 0.1% formic acid in MilliQ water and 0.1% formic acid in acetonitrile with a 0.5 ml/min flow rate and 20 μl injection volume. Except 2-AG, all lipids ionized in the negative ion mode. MRM transitions and retention times are listed in .
MRM: Multiple reaction monitoring.
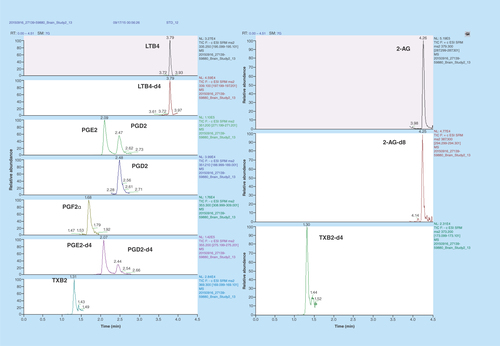
Figure 3. Representative extracted ion chromatograms of TXB2.
We observed a distorted peak for TXB2 at 40°C column temperature as opposed to lower temperature of 20°C. TXB2 exists as anomers at higher temperatures; therefore it was imperative to reduce the column temperature for achieving a sharper peak.
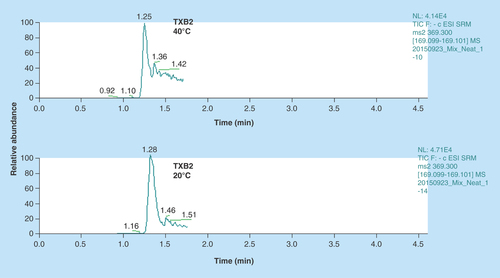
Figure 4. PGE2 levels determined in in vitro microglial cell cultures.
As outlined in the methods section above microglia were cultured from 3-day-old Sprague-Dawley rat pups and treated with Lundbeck analgesic compound for 30 min with or without Bz-ATP for an additional 30 min. PGE2 levels were determined using a commercially available ELISA kit (A) or LC–MS/MS (B). Data represented are mean ± SD from three separate experiments. High cross-reactivity of ELISA kit mentioned by the manufacturer shows approximately threefold higher levels of PGE2 compared with more specific LC–MS/MS analysis.
*p < 0.05 when compared with bz-ATP-treated cells.
BzATP: 2,3-O-(4-benzoylbenzoyl)-adenosine triphosphate; LC-MS/MS: Liquid chromatography tandem mass spectrometry.
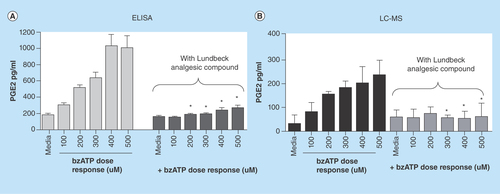
Figure 5. Quantitation of lipids in CNS tissues from in vivo study using LC–MS/MS.
All the lipids were successfully quantified with acceptable recoveries and sensitivity using triple quadrupole mass spectrometer. Control rats (saline treated) and rats undergoing a chronic constriction injury of the sciatic nerve were treated with Lundbeck analgesic compound at 10, 30 and 100 mg/kg orally as, described in the methods section above. LODs and quantitation for the lipids are listed in . In brain (A), significant changes were observed with PGE2 and LTB4 levels in CCI rats after treatment with analgesic compound when compared with CCI+Veh group. In spinal cord (B), significant changes were observed with PGE2, PGF2α, LTB4 and 2-AG in CCI rats with Lundbeck analgesic compound compared against CCI+Veh treated animals.
*p < 0.05 when compared against CCI+Veh. Data shown are mean ± SD from seven to ten animals per treatment group.
CCI: Chronic Constriction Injury; veh: Vehicle.
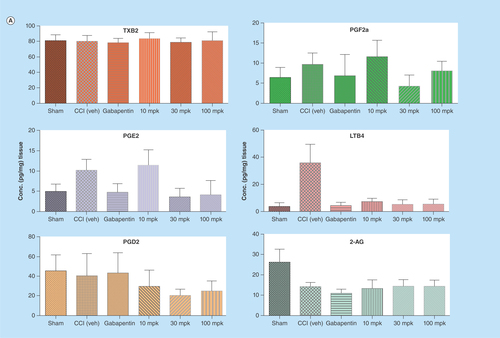
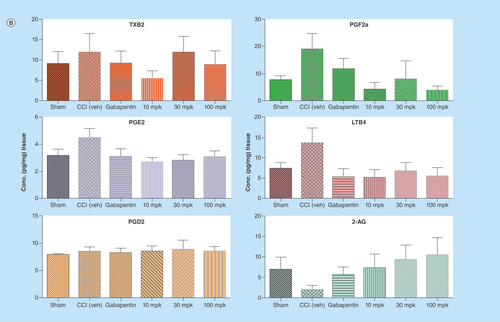
Table 1. Multiple reaction monitoring parameters of lipids: all the lipids except 2-AG were ionized in negative electrospray ionization mode on Thermo Quantum Triple Stage Quadrupole mass spectrometer.
Table 2. LOD and LOQ of lipids: determination of LOD was based on an S/N ratio of 3:1 and LOQ was based on an S/N ratio of 10:1.