Figures & data
Figure 1. mRNA expression of Igf2, H19, Plagl1, Igf2r and Igf1 genes in offspring liver, (A) at D0, (B) at D21 (mean ± sem).
###p < 0.001; ####p < 0.0001 (effect of methyl donor supplementation, two-way ANOVA).
*p < 0.05; **p < 0.01. (Bonferroni post hoc comparisons) (n = 8/group).
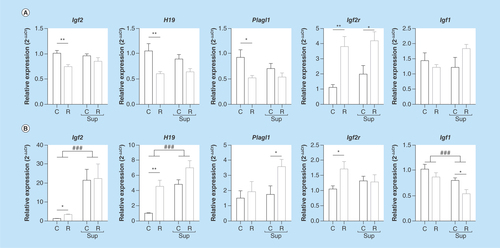
Figure 2. mRNA expression of Igf2-specific transcripts expressed from promoters P1, P2 and P3 in offspring liver.
(A) genomic structure of the Igf2 gene. Noncoding exons are represented by open boxes and coding exons by filled boxes. The position of the P1, P2 and P3 promoters are indicated by arrows above the exons. Polymerase chain reaction products used to quantify the promoter-specific or the total Igf2 transcripts are presented below the gene structure. (B & D) Relative expression of the P1, P2 and P3 specific transcripts in the C group at D0 (B) and D21 (D). (C & E) Relative expression of the P1, P2 and P3 specific transcripts in the four experimental groups at D0 (C) and D21 (D) at D21. Data are expressed as mean ± SEM (n = 8/group).
###p < 0.001, ####p < 0.0001 (effect of methyl donor supplementation, two-way ANOVA).
*p < 0.05, **p < 0.01 (Bonferroni post hoc comparisons).
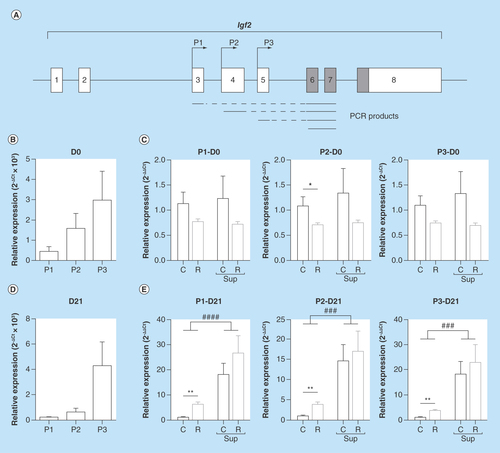
Figure 3. DNA methylation in offspring liver at Igf2 differentially methylated regions.
(A) Genomic structure of the Igf2/H19 locus. Non-coding exons are represented by open boxes and coding exons by filled boxes. The position of the P1, P2 and P3 promoters are indicated by arrows. The positions of the different differentially methylated regions (DMRs), the intron 2 CpG islands and the imprinted control regions are indicated below the gene structure. (B & C) Methylation level of the DMR0 at D21 (n = 4–5/group), and DMR1 at D0 (n = 6/group) and D21 (n = 6/group). Each dot represents the average (mean) methylation level of six (DMR0) or four (DMR1) CpG sites for one specific DNA sample. (D & E) Methylation level of individual CpG sites from the Igf2 intron 2 CpG island (D) and Igf2 DMR2 (E) at D0 and D21 (mean ± SEM; n = 5–6/group).
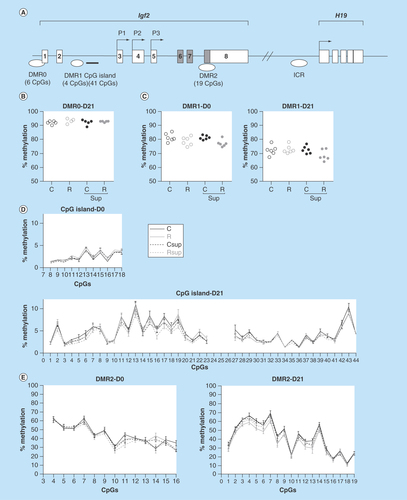
Figure 4. DNA methylation in offspring liver at H19 imprinting control region.
(A) Genomic structure of the H19 upstream region. The position of the two CpG islands corresponding to the two parts of the imprinted control region (ICR) are indicated above the line. The CpG sites analyzed in this study are indicated below the line, as well as the position of the CTCF binding sites. (B, C & D) Methylation levels of individual CpG sites from the ICR1 (B), ICR2 (C) and H19 promoter (D) at D0 and D21. The CpG sites embedded in the CTCF binding sites 1 to 4 are indicated by arrows above the curves (mean ± SEM) (n = 6/group).
CTCF: CCCTC-binding factor.
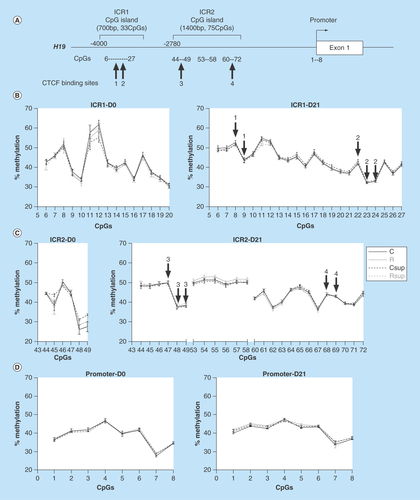
Figure 5. DNA methylation level in offspring liver of the CpG island covering the promoter, exon 1 and part of intron 2 of the Igf2r gene.
(A) Position of the CpG island and of the CpG sites analyzed in this study. (B) Methylation level of individual CpG sites at D0 and D21 (mean ± SEM) (n = 6/group)
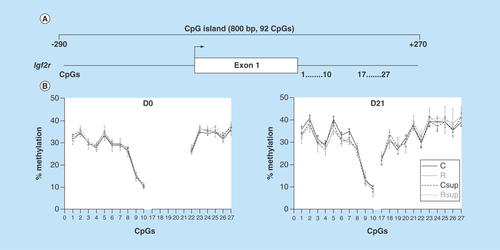
Figure 6. DNA methylation level in offspring liver of the CpG island covering the promoter, exon 1 and part of intron 2 of the Plagl1 gene.
(A) Position of the CpG island and of the CpG sites analyzed in this study. (B & C) Methylation level of individual CpG sites at D0 (B) and D21 (C).
*p < 0.05 (Dunn's post hoc test performed on the global mean of methylation levels for the considered CpG sites; mean ± SEM; n = 6/group).
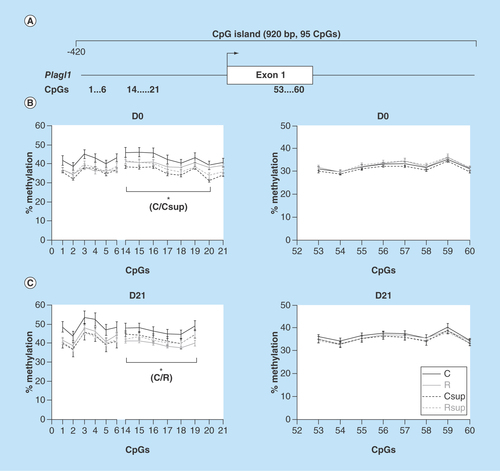
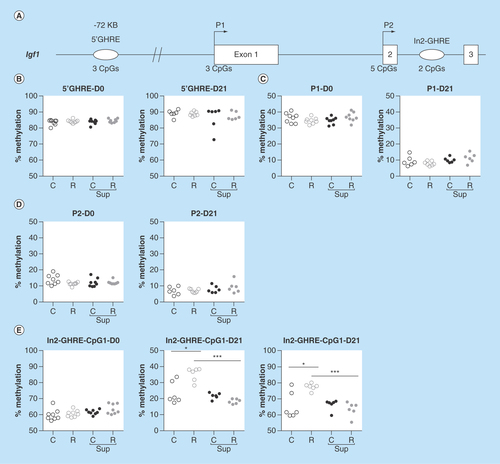
Figure 7. DNA methylation level in offspring liver of the growth hormone responsive elements and promoters of the Igf1 gene.
(A) Position of the analyzed regions relative to the Igf1 gene, the exons are represented by open boxes, the promoters by arrows and the growth hormone responsive element (GHREs) by ovals. The number of CpG sites analyzed in this study is mentioned above the line. (B–D) Average methylation level of the 5′GHRE (B), Promoter P1 (C), Promoter P2 (D) at D0 and D21. Each dot represents the average (mean) methylation level of 3 (5′GHRE and P1) or 2 (P2) CpG sites for one specific DNA sample. (D) Methylation level of individual CpG sites in the intron2 (In2)-GHRE at D0 and D21.
*p < 0.05, ***p < 0.001 (Dunn's post hoc test). (n = 6/group).